
Investigating UK Companies: What can we learn from the ONS and Companies House?
Last week I found a page by the Office for National Statistics (ONS) breaking down UK companies by Standard Industrial Classification and turnover. I noted it in my weekly Consumption post, and I’ve decided to dig into it further to find out what other interesting information the ONS and Companies House may provide.
The data I found last week was from 2018 - a bit old. It was filed under Activity, size and location, and looking there, I found a wealth of more up-to-date publications and data. Two in particular stood out.
The first one that caught my eye was UK business; activity, size and location: 2022 (data). As the name suggests, it covers business activity, sizes (turnover and employment), and location, in a variety of permutations. I’m going to call this one ASL from now on (no, not age, sex, location from old internet days).
The next was Business demography, UK: 2021 (data). This discusses births and deaths of companies, by region and industry.
Finally, what if I combine this with Companies House to investigate existing organisations?
I decided to have a look through the data - I don’t know what I’ll find, so this was more out of curiosity than anything else!
Which industries have the most staff and the highest turnovers?
Within the ASL dataset, the most interesting categories to me were the total number of companies, company sizes by employee count, and company sizes by turnover, all by industry/sector.
Let’s graph them out. First, the obvious one:
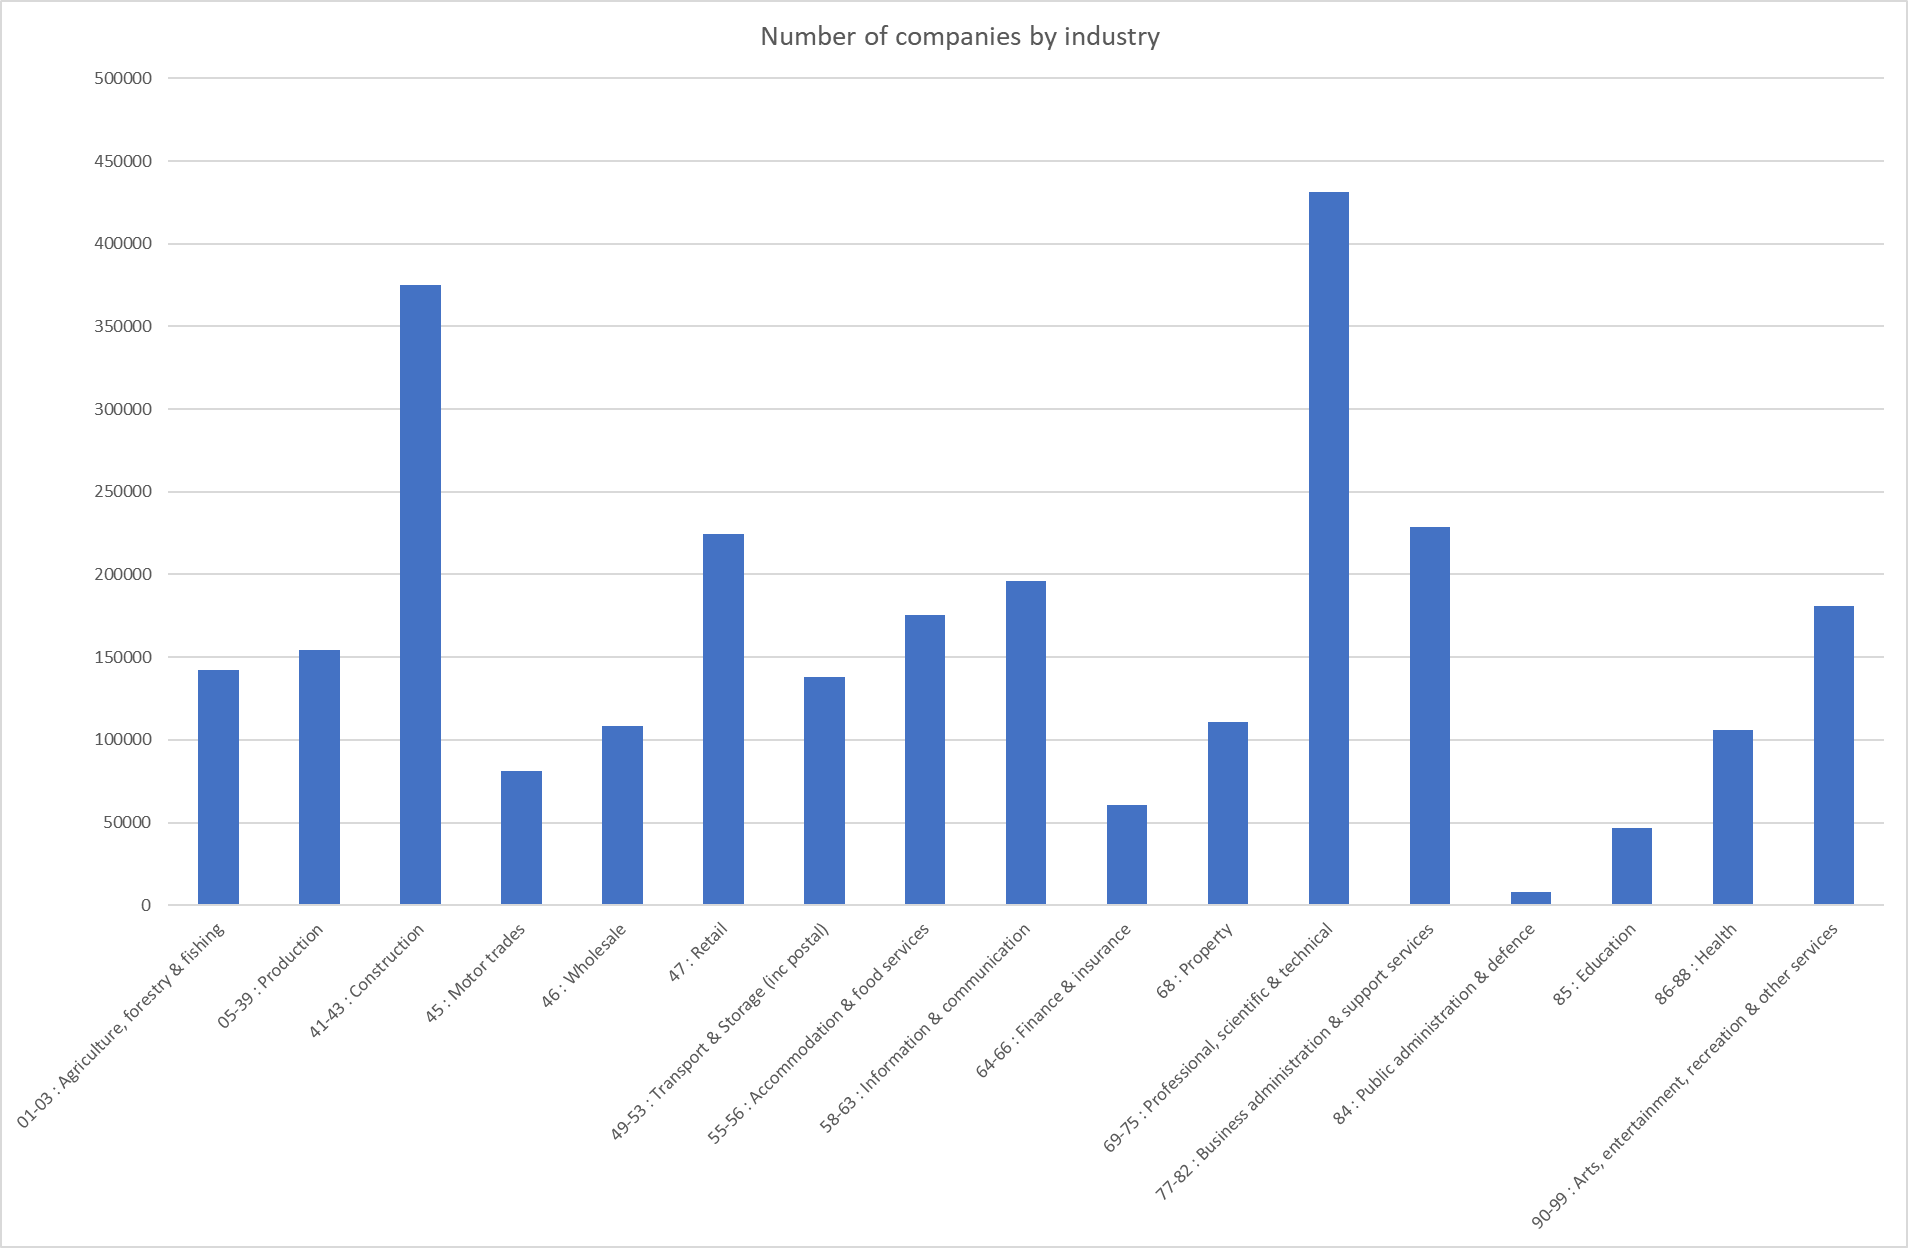
There are significantly more Professional, scientific & technical and Construction companies than others. In comparison very few Public administration & defense; Finance & insurance, Education, and Motor trades, are also pretty low. What can we infer from this?
A high number of companies may suggest high competition, although not necessarily - if the Construction industry consists of a high number of small companies each serving only a local area, some geographies may have relatively low competition. A high number also suggests low barriers to entry (either currently or historically), such as low regulatory or financial requirements.
On the other hand, a low number of companies suggests starting a company in that industry may be difficult to enter. It may suggest only a few customers (i.e. relatively low demand being met be relatively low supply), as you could imagine with the defense industry. However, it may simply mean there is low competition - perhaps a good market to enter!
Now looking at employee counts:
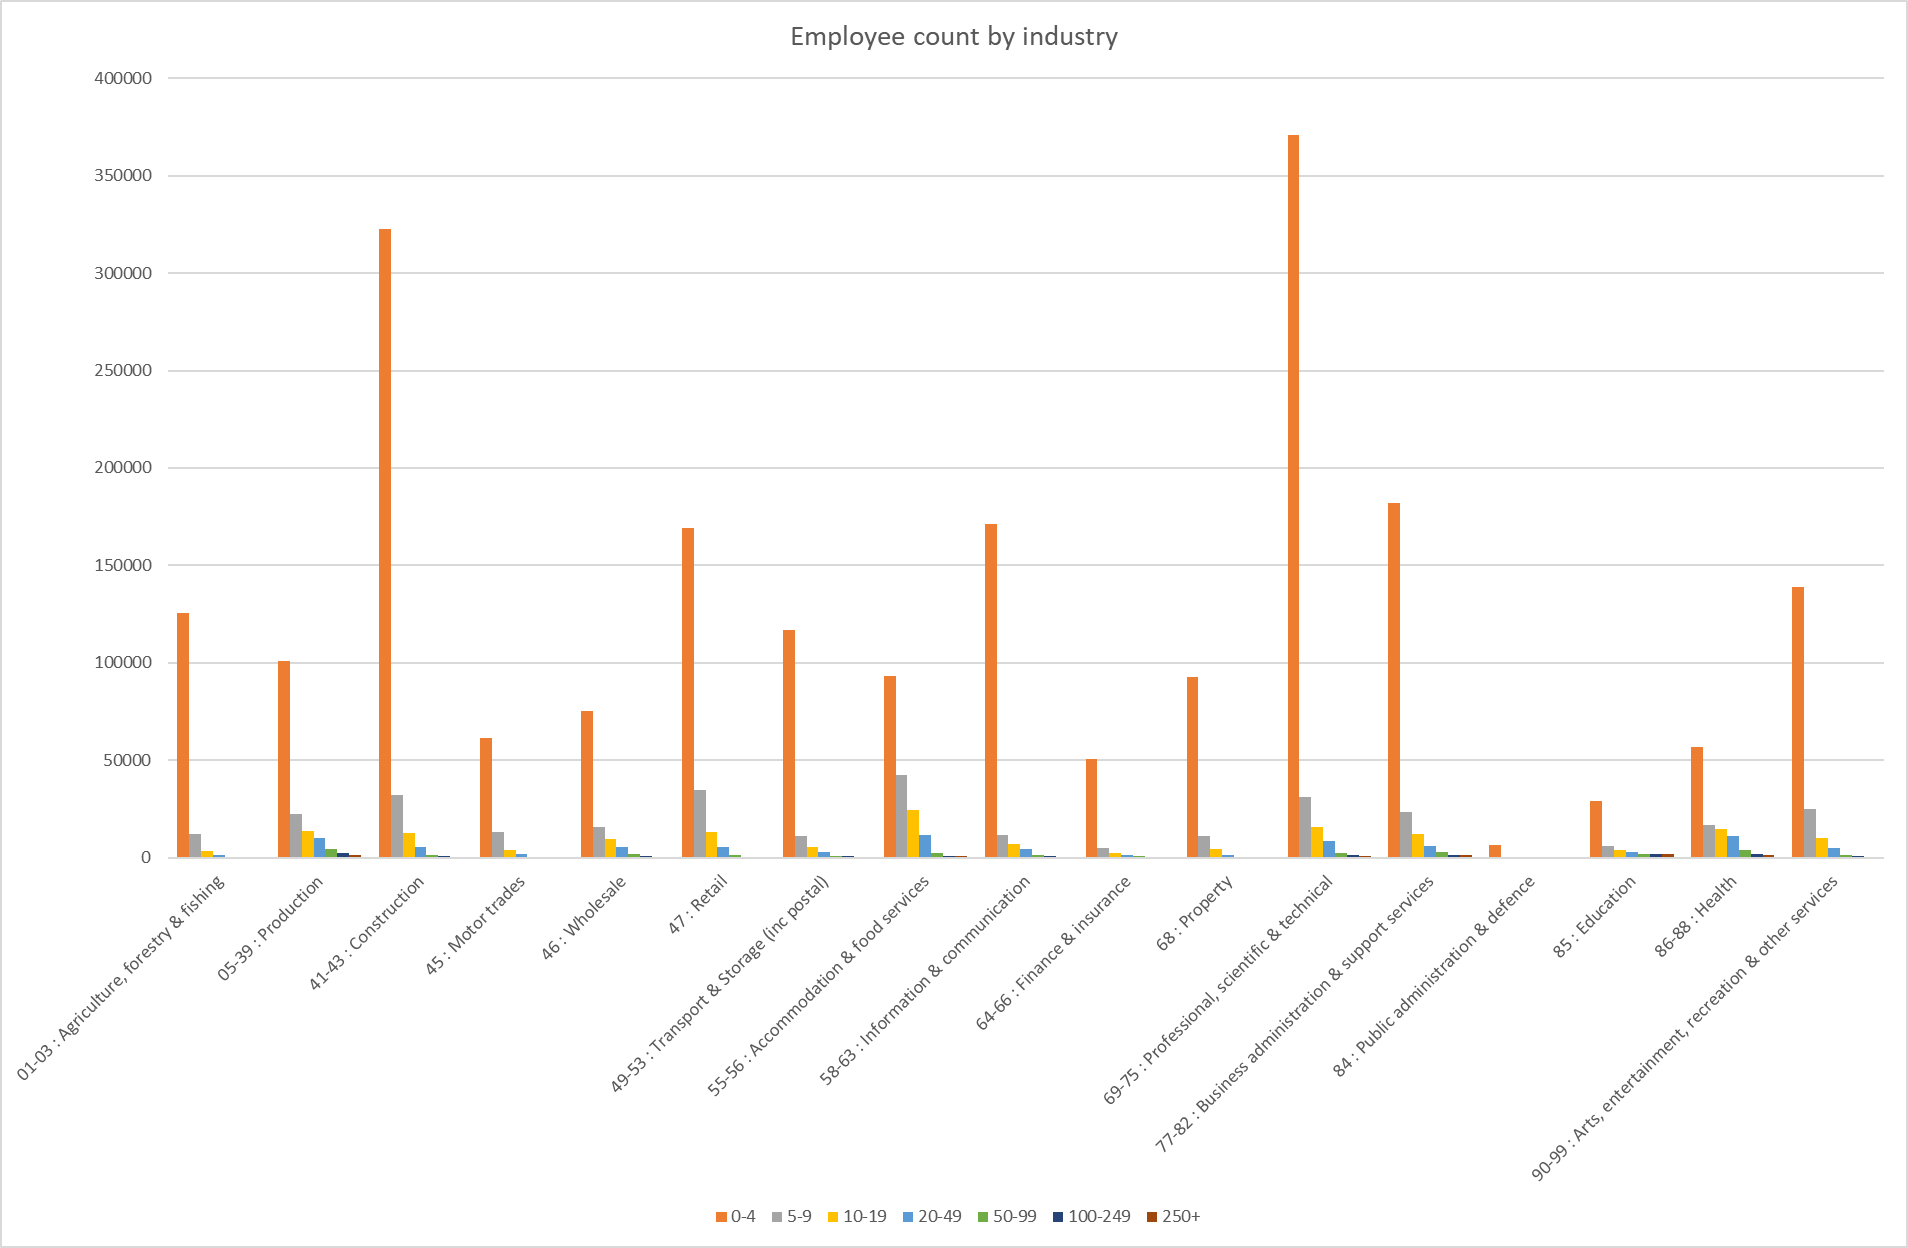
Not much more can be gained from this - most industries seem to follow a similar trend, with a the majority of the companies having very few employees. Accommodation & food services seems to be the further from the others, which is not surprising, given your average restaurant would need more than 4 people to operate. Additionally, salaries are generally low, meaning it’s cheaper to have a company with more employees.
Next, turnover:
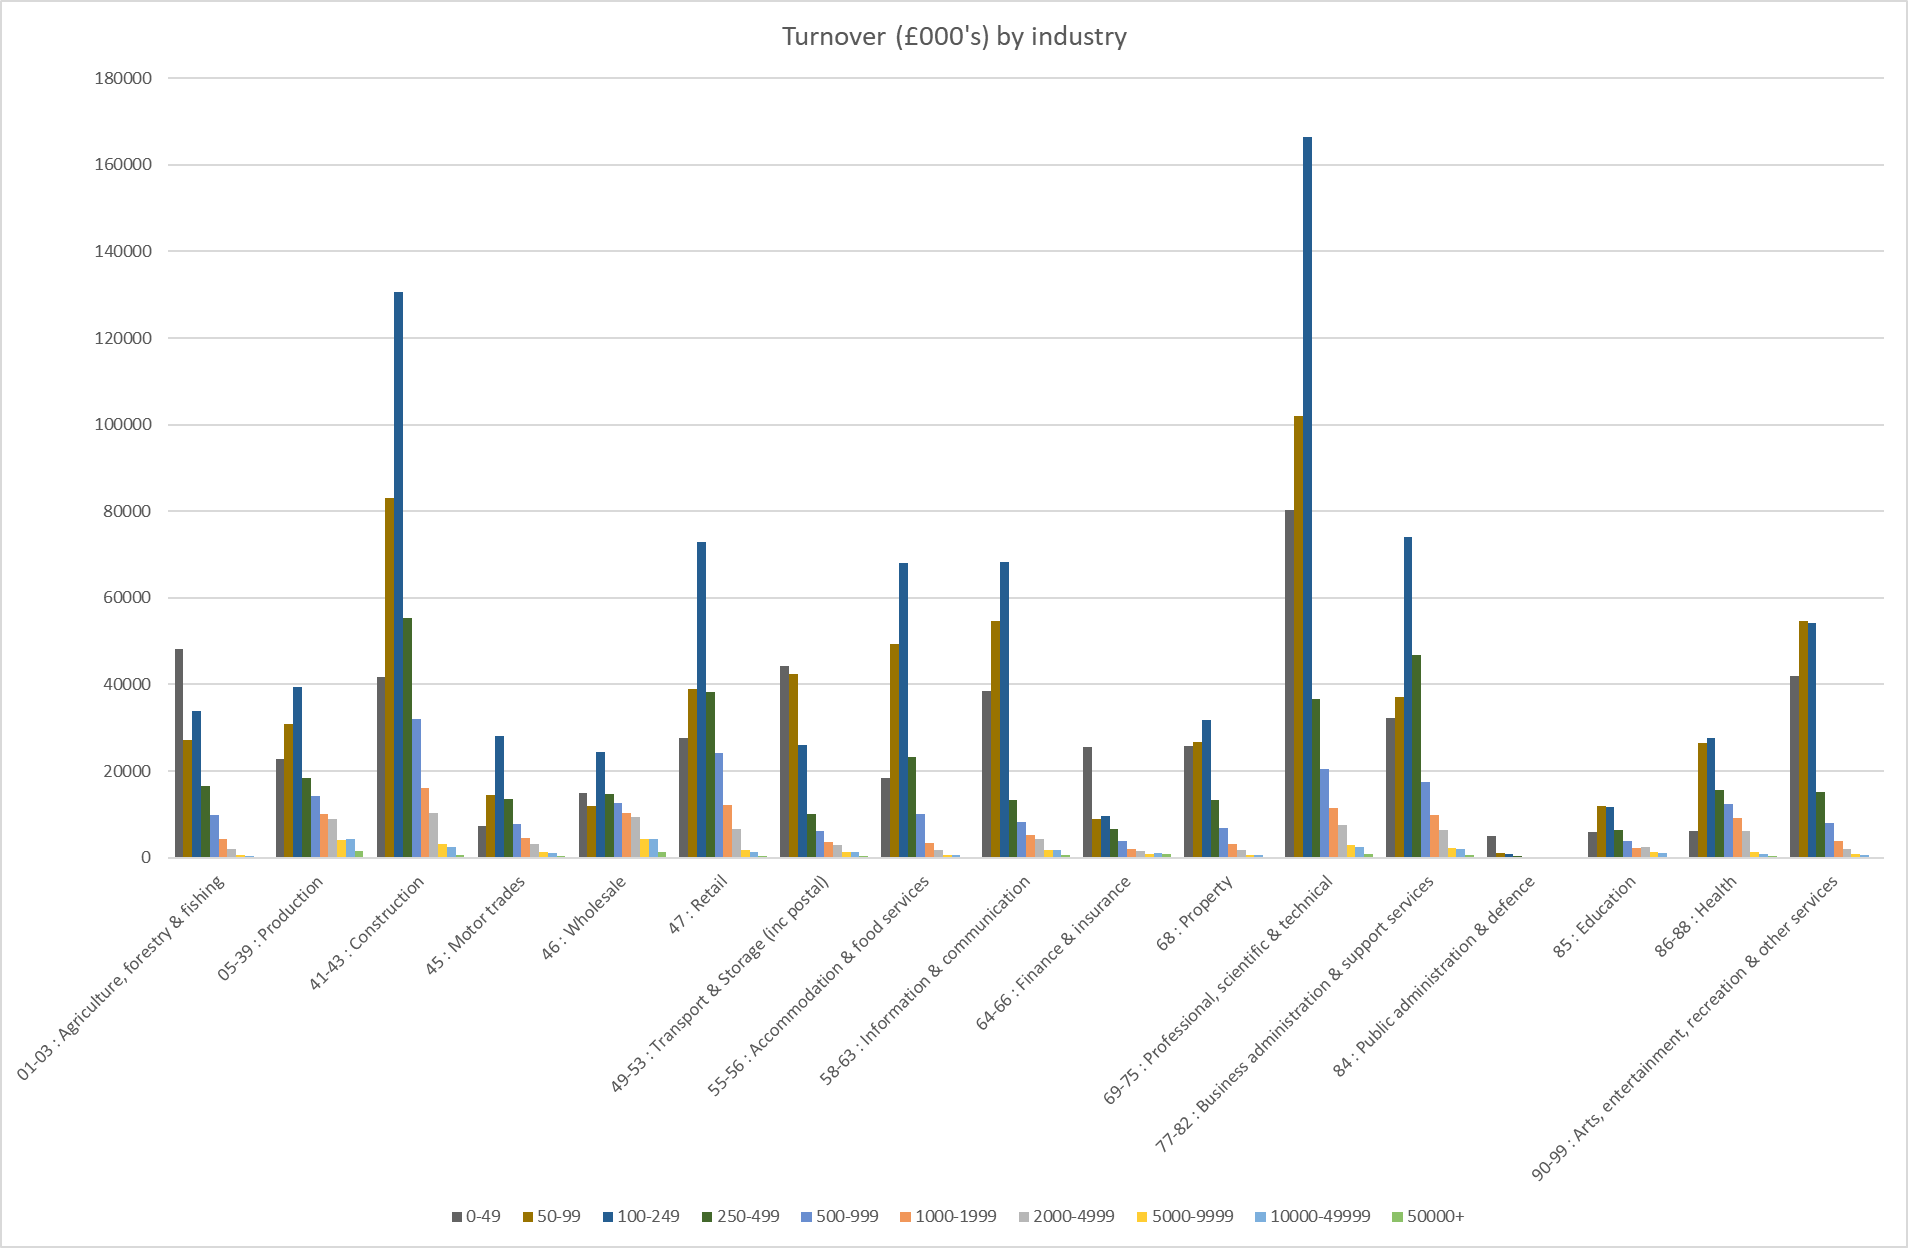
Not much here either really. Again, most industries follow a similar trend, with a couple outliers - for both Agriculture, forestry & fishing and Transport & storage, most companies have turnovers of only £0-£49,999, compared with £100,000-£249,999 that most others have. The spread of turnover in Wholesale seems more even than other industries, with a similar number of high-turnover to low-turnover companies.
Is there a way to combine the two datasets? For each we don’t have precise numbers, only ranges, and the largest category is “X+”, so we don’t have a maximum value. However, what if we take averages and ignore the largest ones?
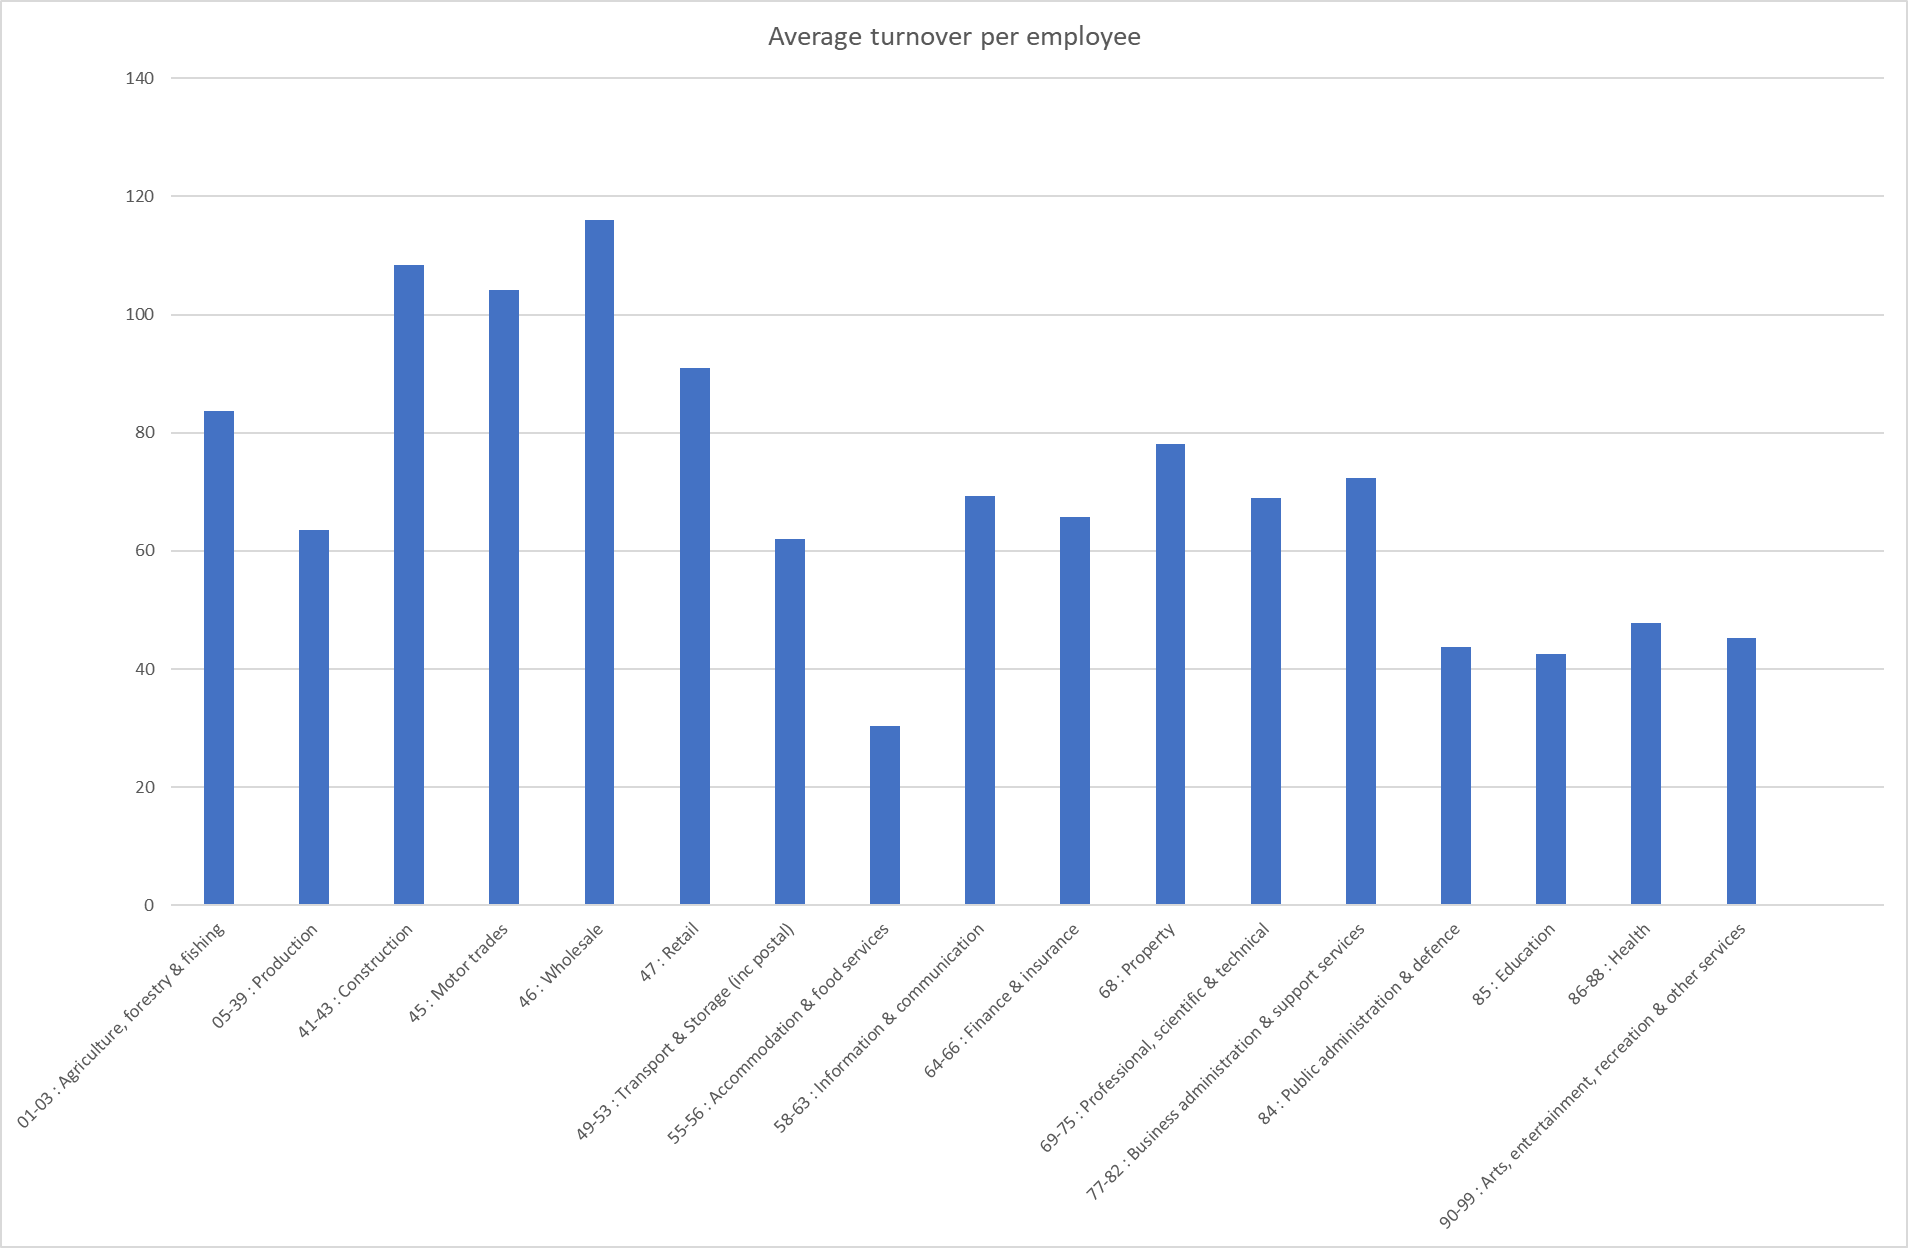
Due to ignoring companies with 250+ employees and turnover over £50,000,000, this is likely incorrect, but it’s still interesting. Accommodation & food services does seem to have by far the lowest turnover per employee, with other low results being Education, Health, the Arts, and Public administration. Wholesale, Construction, and Motor trades seem to have high turnover per employee. Those with low turnover per employee are also industries known for having lower wages, yet those with high turnover are not known for particularly high wages - perhaps they deal in high-volume low-margin projects. I could ponder more conclusions based on this, but given I know the data is incorrect, any conclusions I make may also be incorrect. Still, food for thought.
Talking of the data excluded from the above, it seems that if you want to have a £50,000,000+ turnover company, your best best is Production or Wholesale.
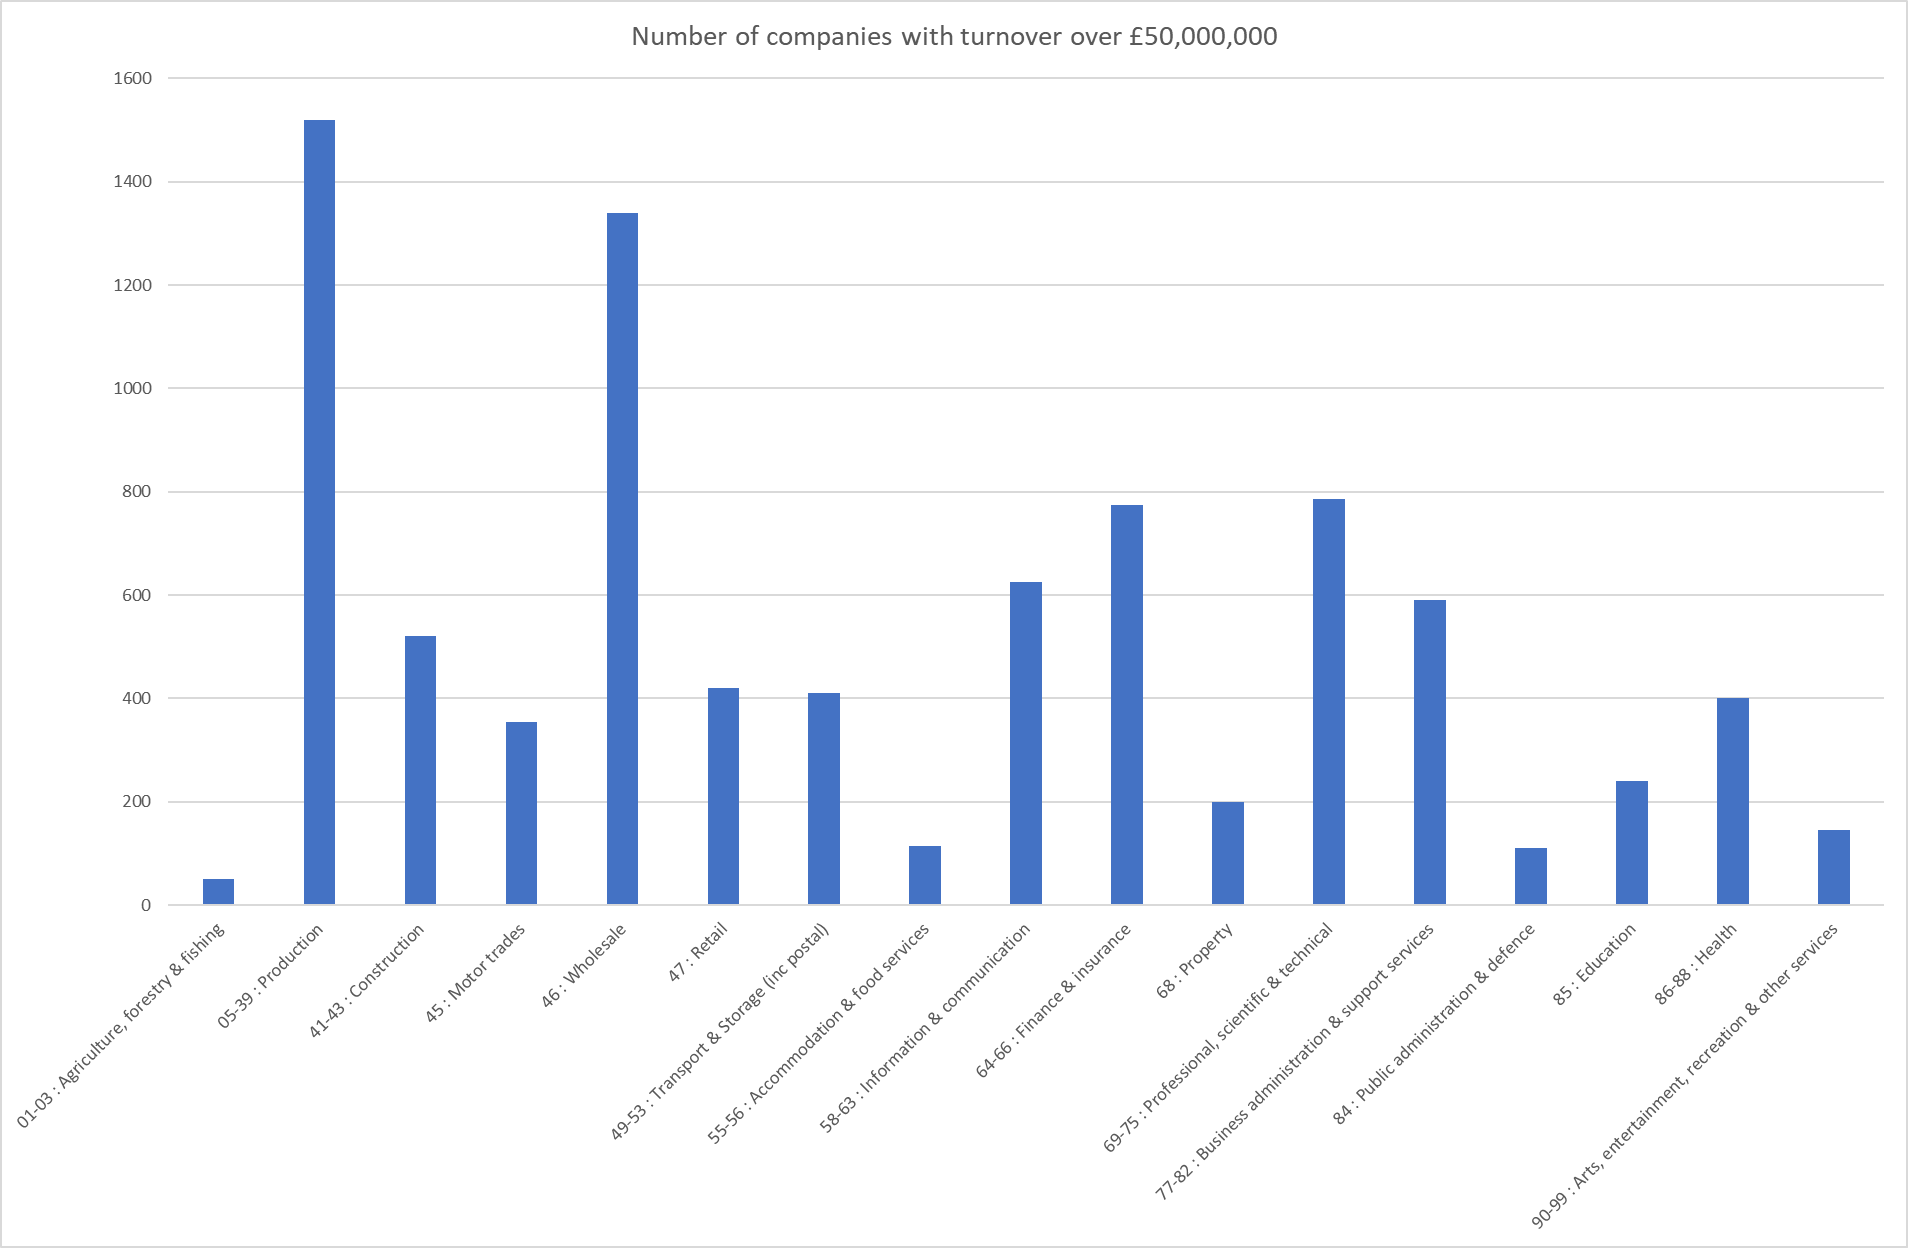
Although high turnover does not necessarily equal high profits!
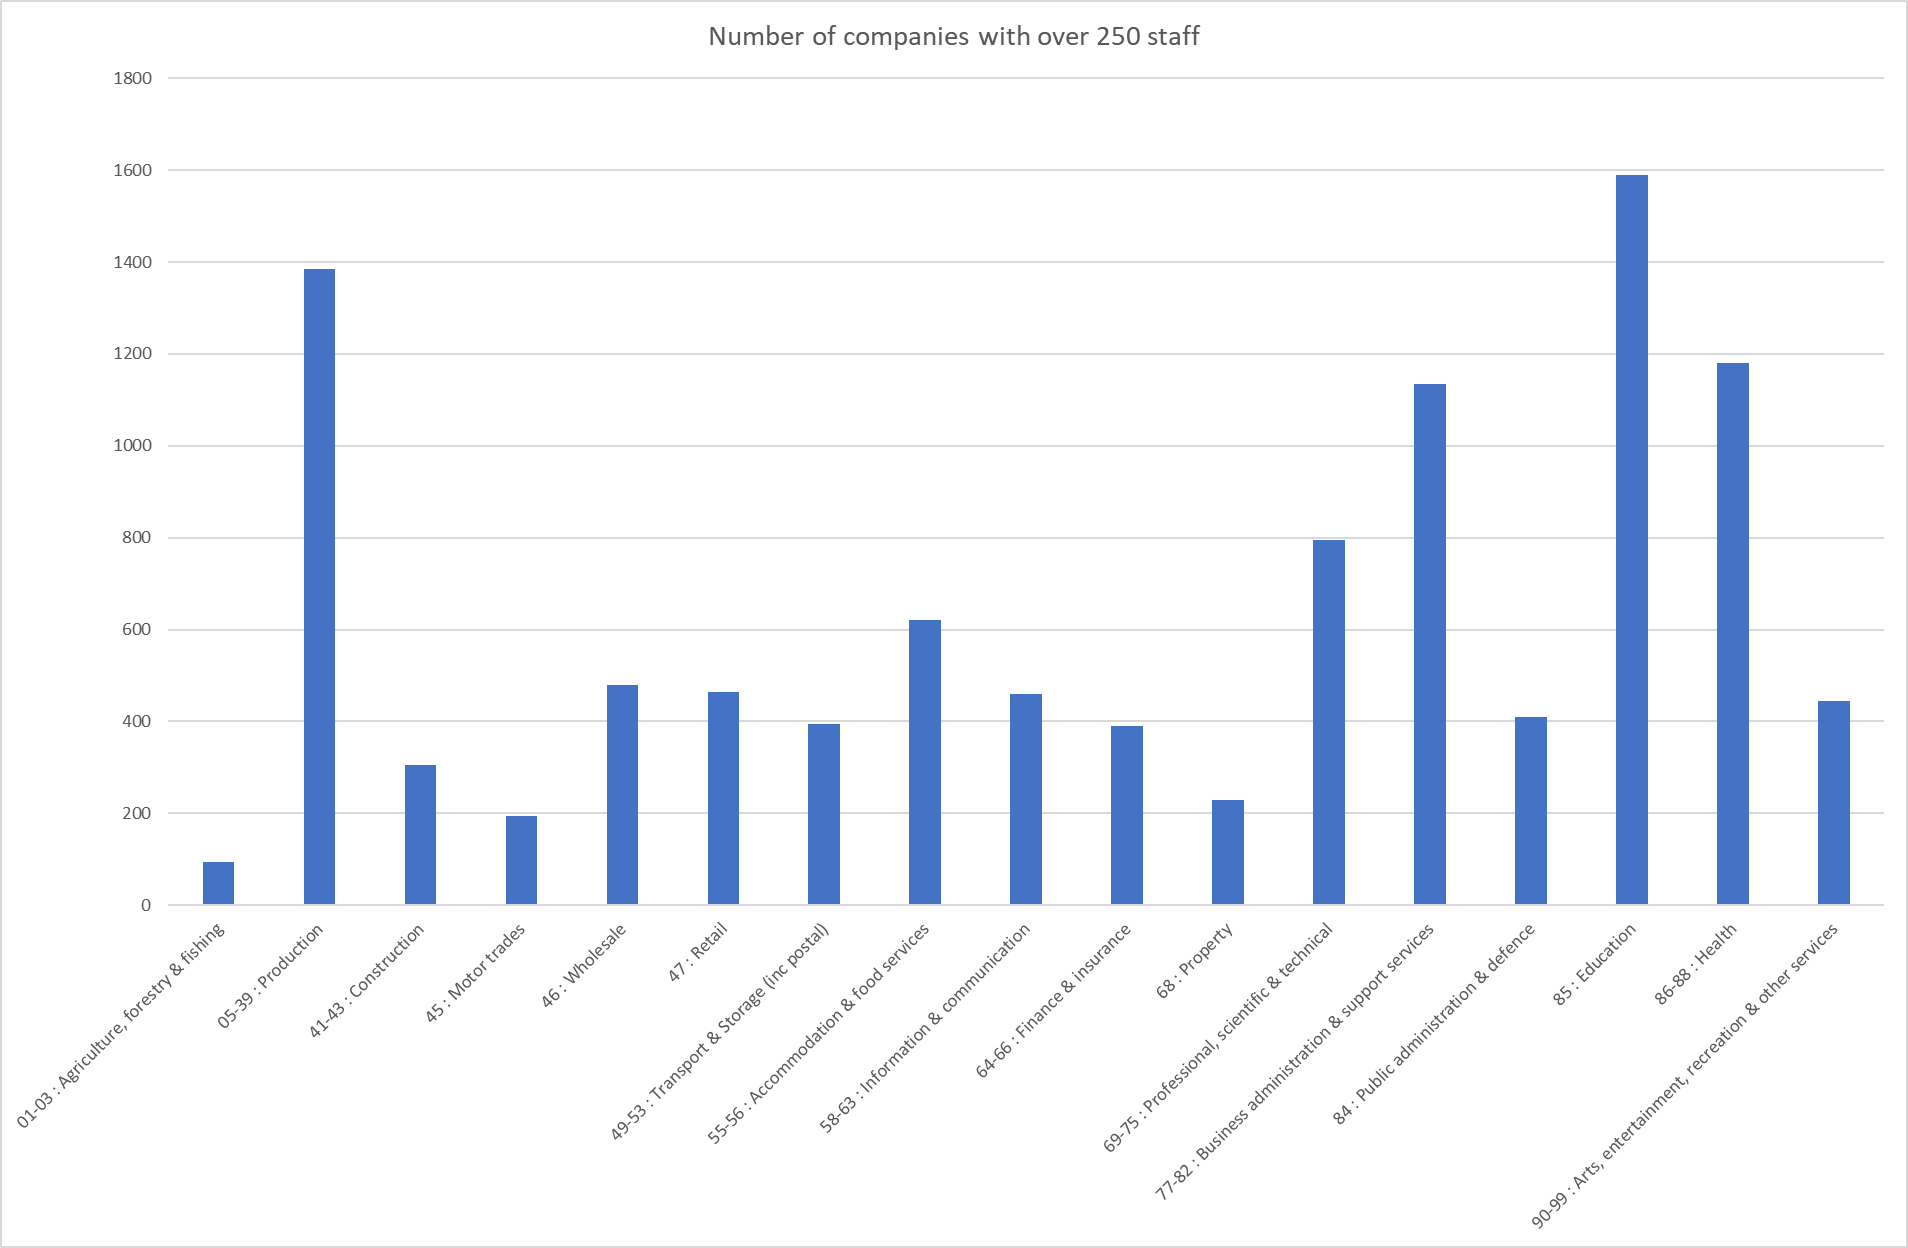
Whereas if you want a company with few staff to worry about, go for Agriculture, forestry & fishing, Motor trades, or Property - don’t get involved in Education or Production:
Which industries live, which industries die?
Using the Demographics dataset and doing some moving and filtering (based on combing the years 2016 to 2021) I got this:
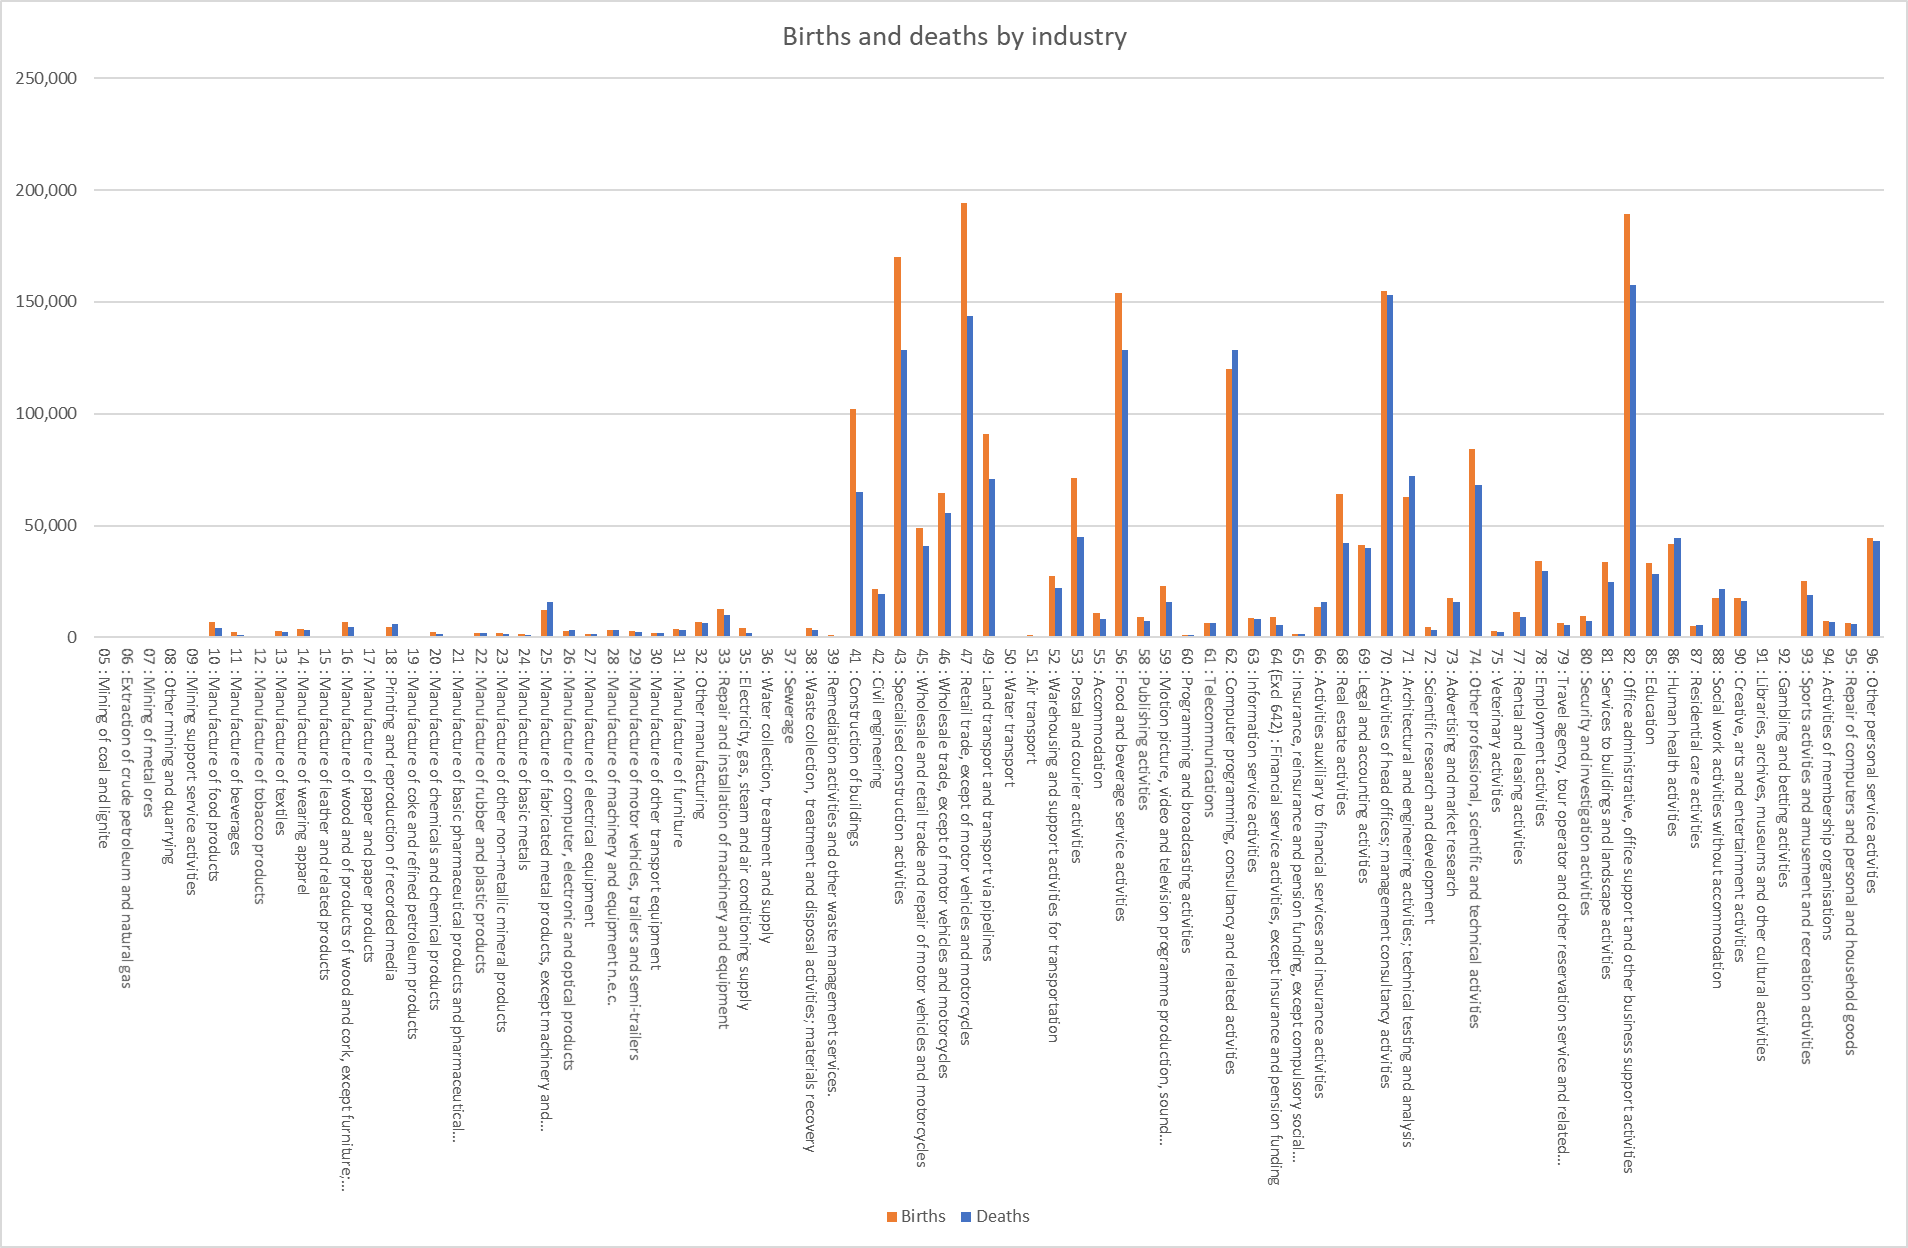
OK, not the most legible, I’m aware. A few things we can pick out:
- Retail has the highest number of births (and the second highest number of deaths).
- Office administration has the highest number of deaths (and the second highest number of births)
It’s worth noting that Production in the ASL dataset consists of SICs starting 05-39, whereas in this dataset they’re split in a large number of sub-categories.
What about the ratio between the two, to see the growth of an industry?
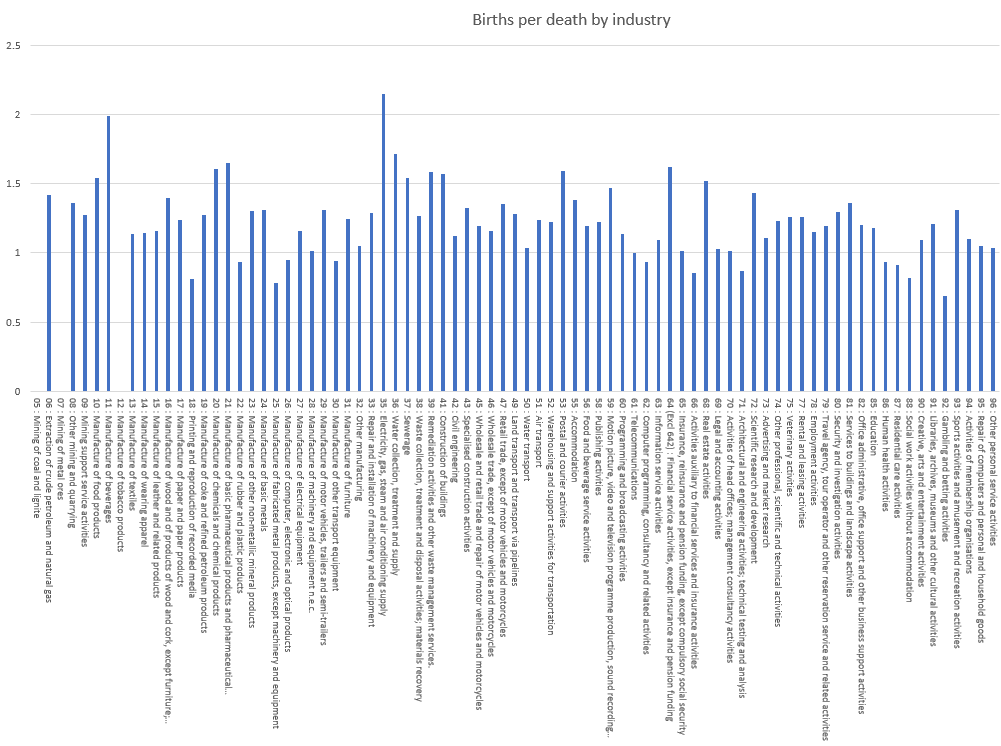
This is much closer. Electricity, gas, steam, and AC supply come out top now (the only one with over two births for every death), followed by Manufacturing of beverages, and Water collection, treatment and supply. Ignoring those with no new births (and hence no bar), the losers are Gambling, Manufacture of fabricated metal products, and Printing and reproduction of recorded media.
Note that a y-axis value of 1 means one death for every one birth - anything below this line means more companies died than were born. 15 industries were below this replacement rate.
Industries with more births than deaths could imply there is high demand, low barriers to entry, or disruption enabling innovation. However, a long-term analysis would be needed to see if this ratio changes over time - for example, perhaps there was a boom in Computer programming, consultancy and related activities in previous years, leading to a high number of unsustainable startups, which are only failing now.
One more graph:
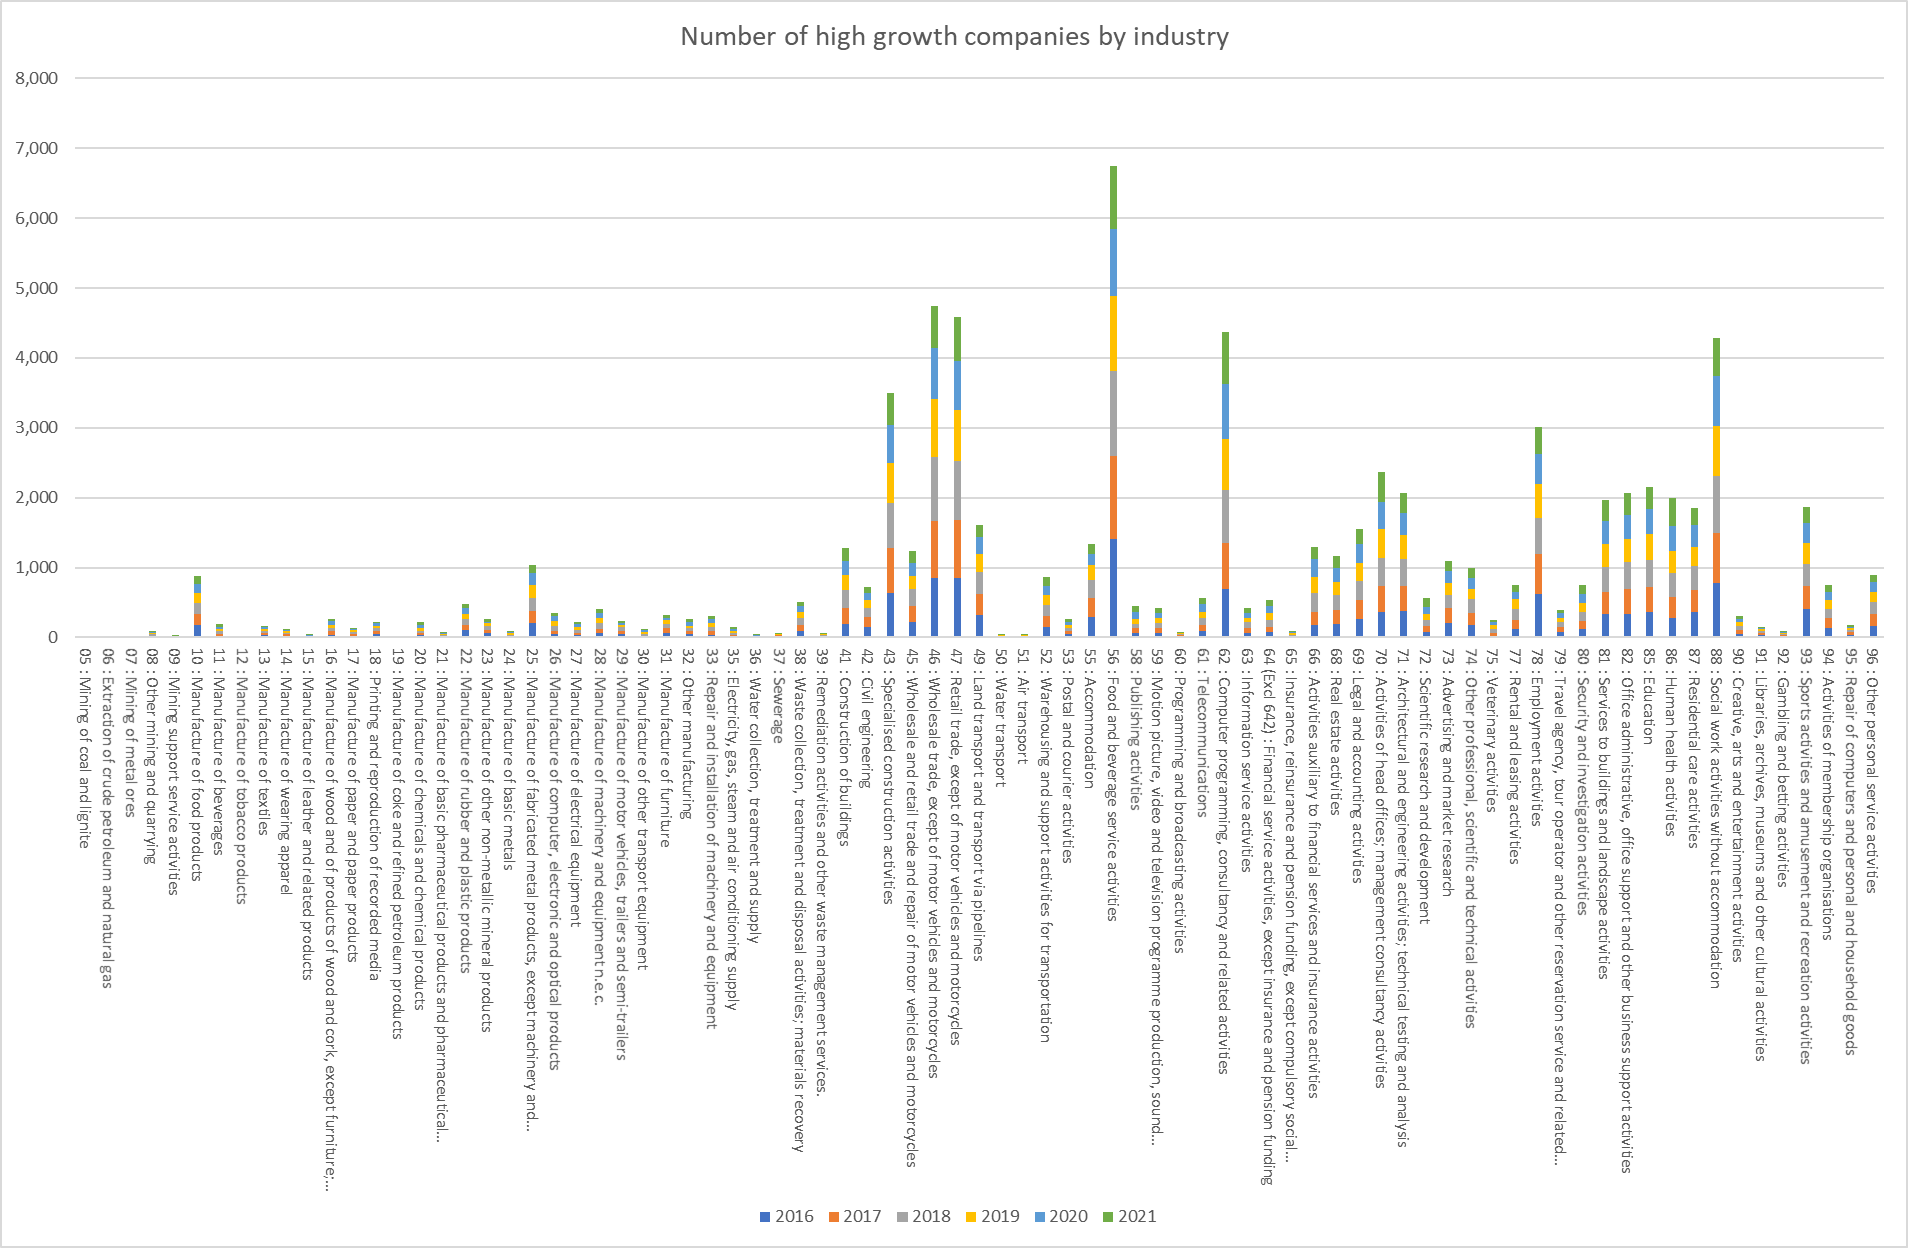
High growth companies (average annualised growth greater than 20% per annum, over a three year period) by industry. The huge spike in the middle is Food and beverage service activities. The other four higher ones are Wholesale trade, Retail trade (the highest overall birth rate), Computer programming, consultancy and related activities (one of the industries with the worst birth:death ratios), and Social work activities without accommodation. On the other hand, Air/Water transport and Mining have very few (if any) high growth companies.
The more companies in an industry, the higher the chance of there being high growth companies. And yet this doesn’t seem to correlate strongly - only Retail trade is in the top three by number of companies according to the ASL dataset. That said, Food and beverage service activities is one of the industries with the highest number of births, and it’s easier to go from £10 to £100 than £10,000,000 to £100,000,000, so this could help explain some of the data.
Another possible factor is COVID, yet although some of the 2020/2021 high growth companies were likely due to the pandemic (e.g. delivery), it doesn’t explain the overall trends, as the number of high growth companies in the pre-COVID years is similar.
What’s the UK electric vehicle industry like?
Something a bit different now. You’ve probably gathered I like electric vehicles. Some example British companies are Maeving, Arrival, Arc, Birò, and Siticars. Using Companies House, we can find a bunch of info, including incorporation date (is it an established company? is it likely to last?), people (who might be worth contacting? what other companies are they involved in?), and accounts (does it make any money? how much would it cost to start my own?).
What I’m interested in right now is the SIC code. I could simply search the SIC list, but seeing what others doing may uncover some surprises (as you’ll see below). Sometimes it’s best to search by company name (Maeving is pretty unique), but sometimes it’s best to check the company website and use the company number (there are over 44,000 companies featuring “Arc” but only one company with the ID 12529130). This is what I found:
- 29100 - Manufacture of motor vehicles
- 29310 - Manufacture of electrical and electronic equipment for motor vehicles and their engines
- 30120 - Building of pleasure and sporting boats
- 30910 - Manufacture of motorcycles
- 45111 - Sale of new cars and light motor vehicles
- 46180 - Agents specialised in the sale of other particular products
- 72190 - Other research and experimental development on natural sciences and engineering
It seems there is no specific SIC for electric vehicles, which isn’t a bit surprise. I’m going to focus on 30910, although this is all motorbike companies, not just electric ones.
Doing an advanced search on Companies House for this SIC code provides 404 companies, of which 217 are active and 186 are dissolved (and 1 in liquidation). Now we have an idea of the size of the market - I never knew there were that many motorcycle manufacturers in the UK!
Going to our first dataset, ASL. I need to trim the trailing 0 from the SIC - it uses 3091. I can quickly search the whole dataset in Excel for this value, and it has data in five tables. Charting them:
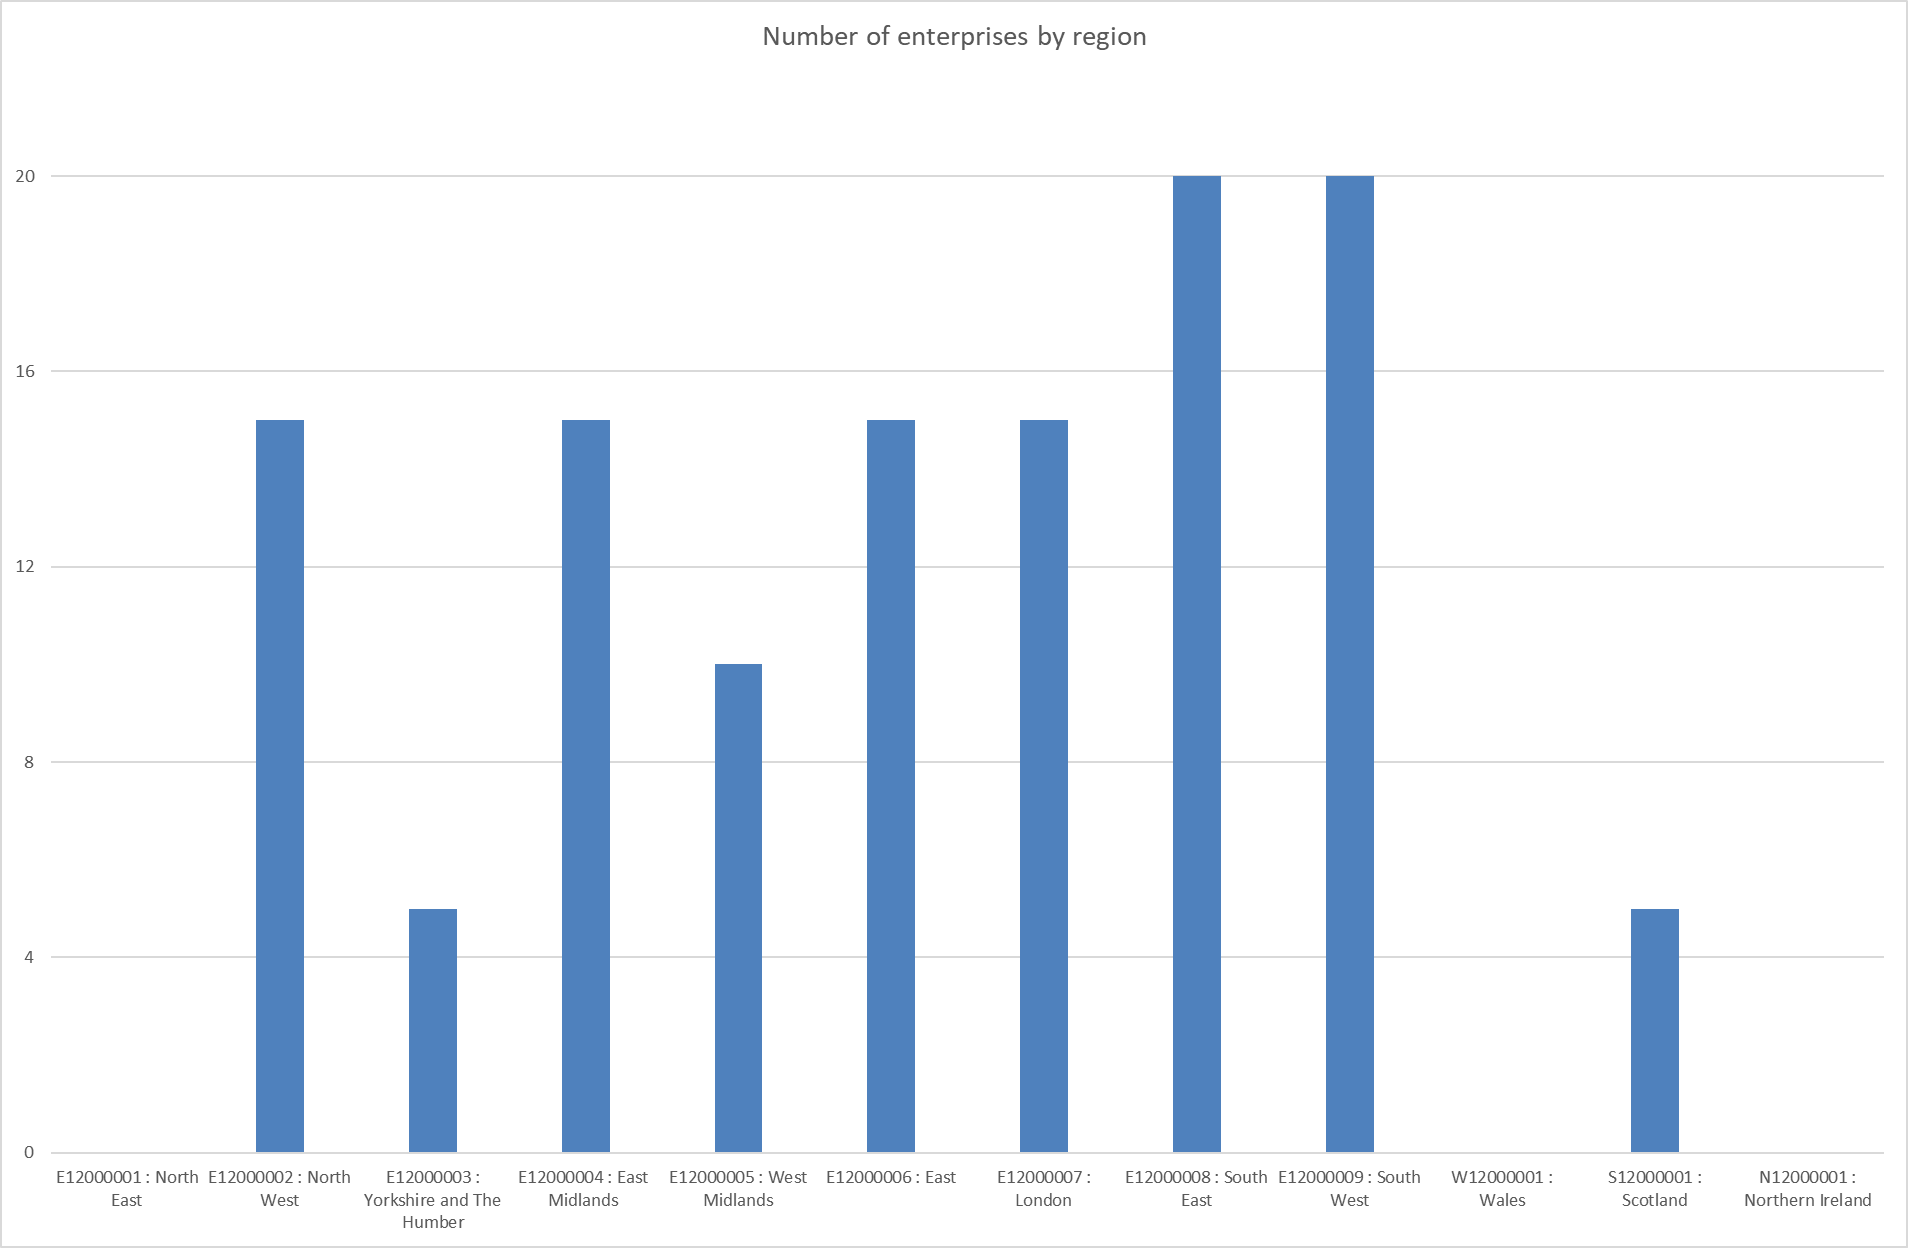
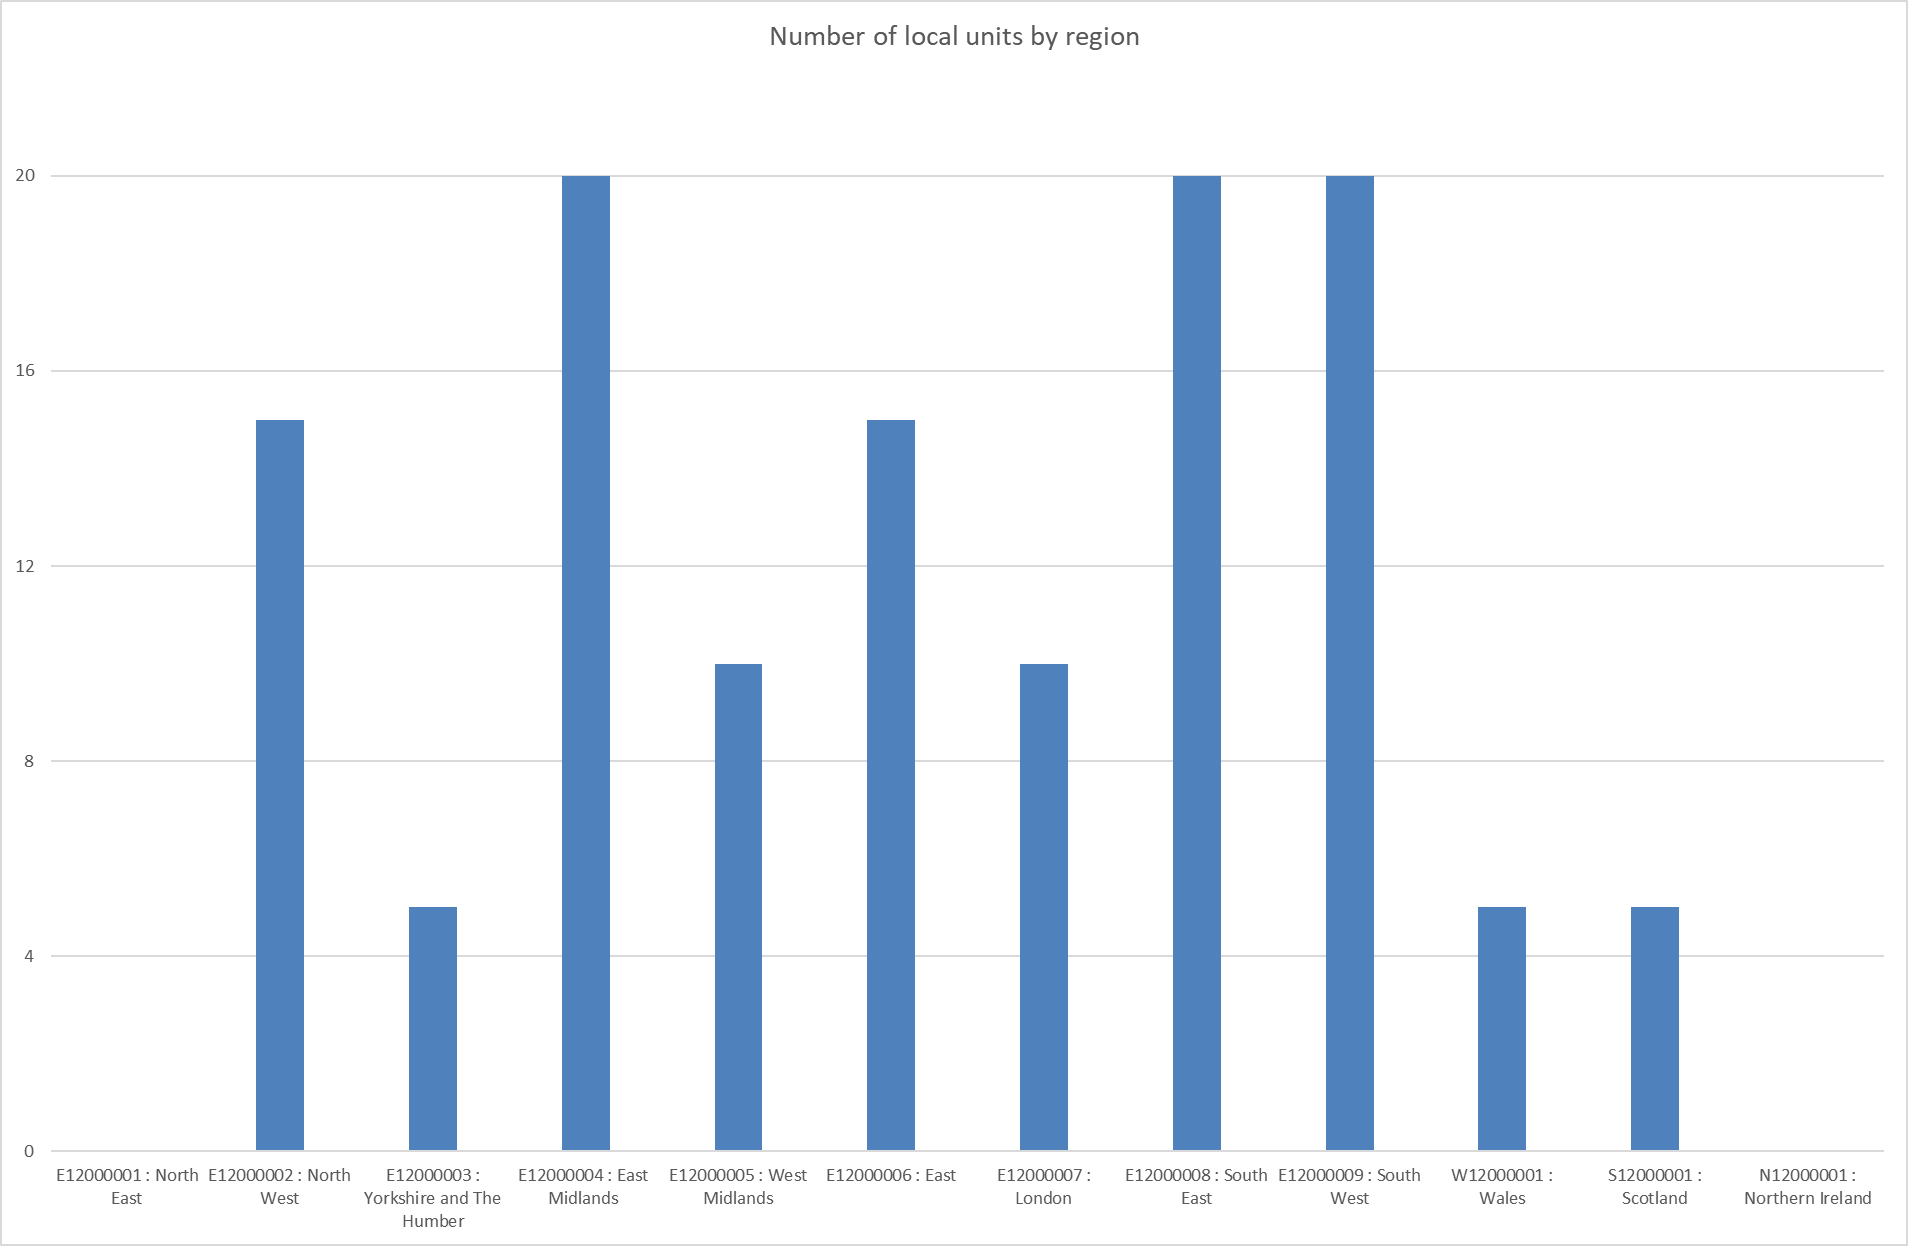
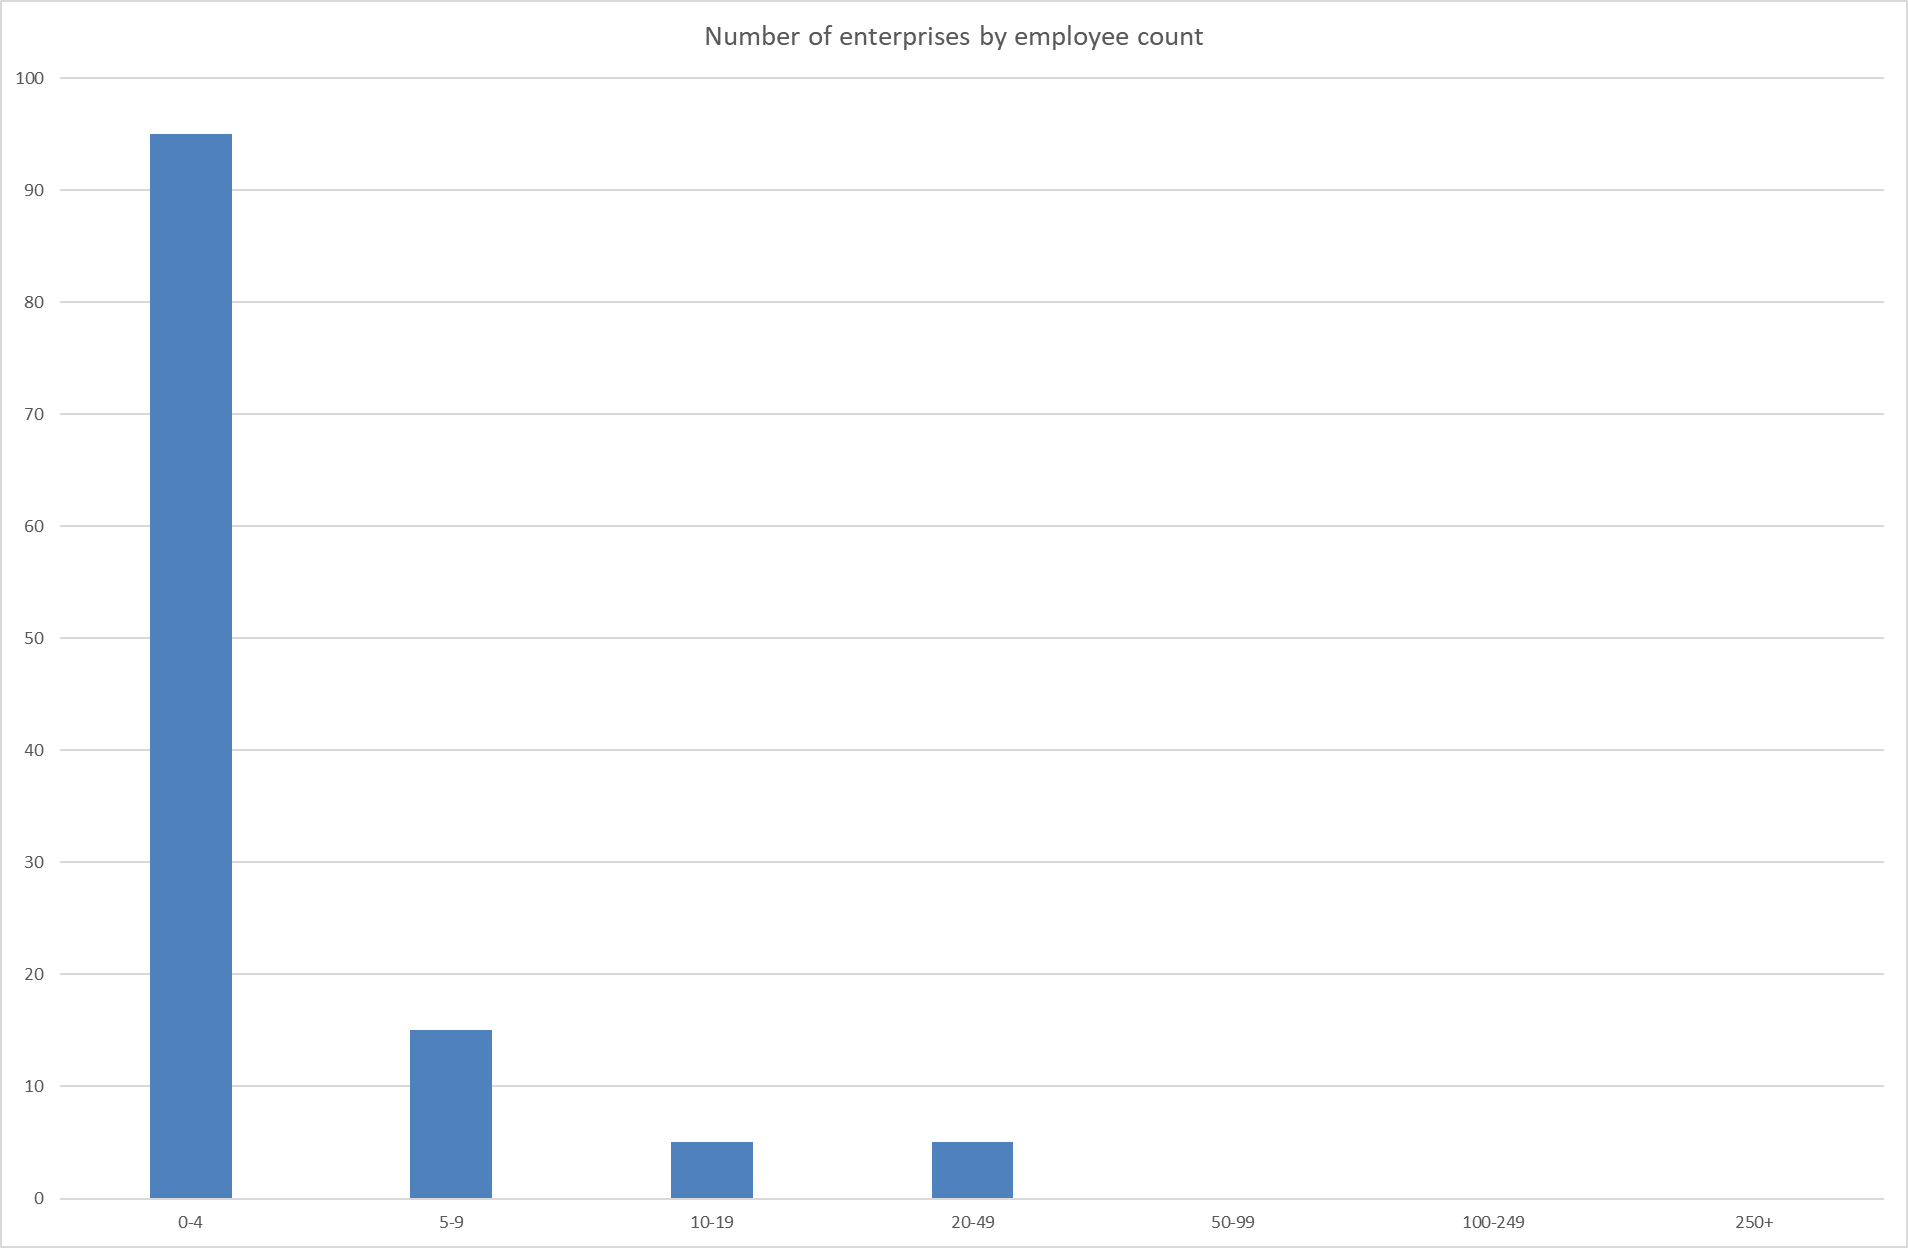
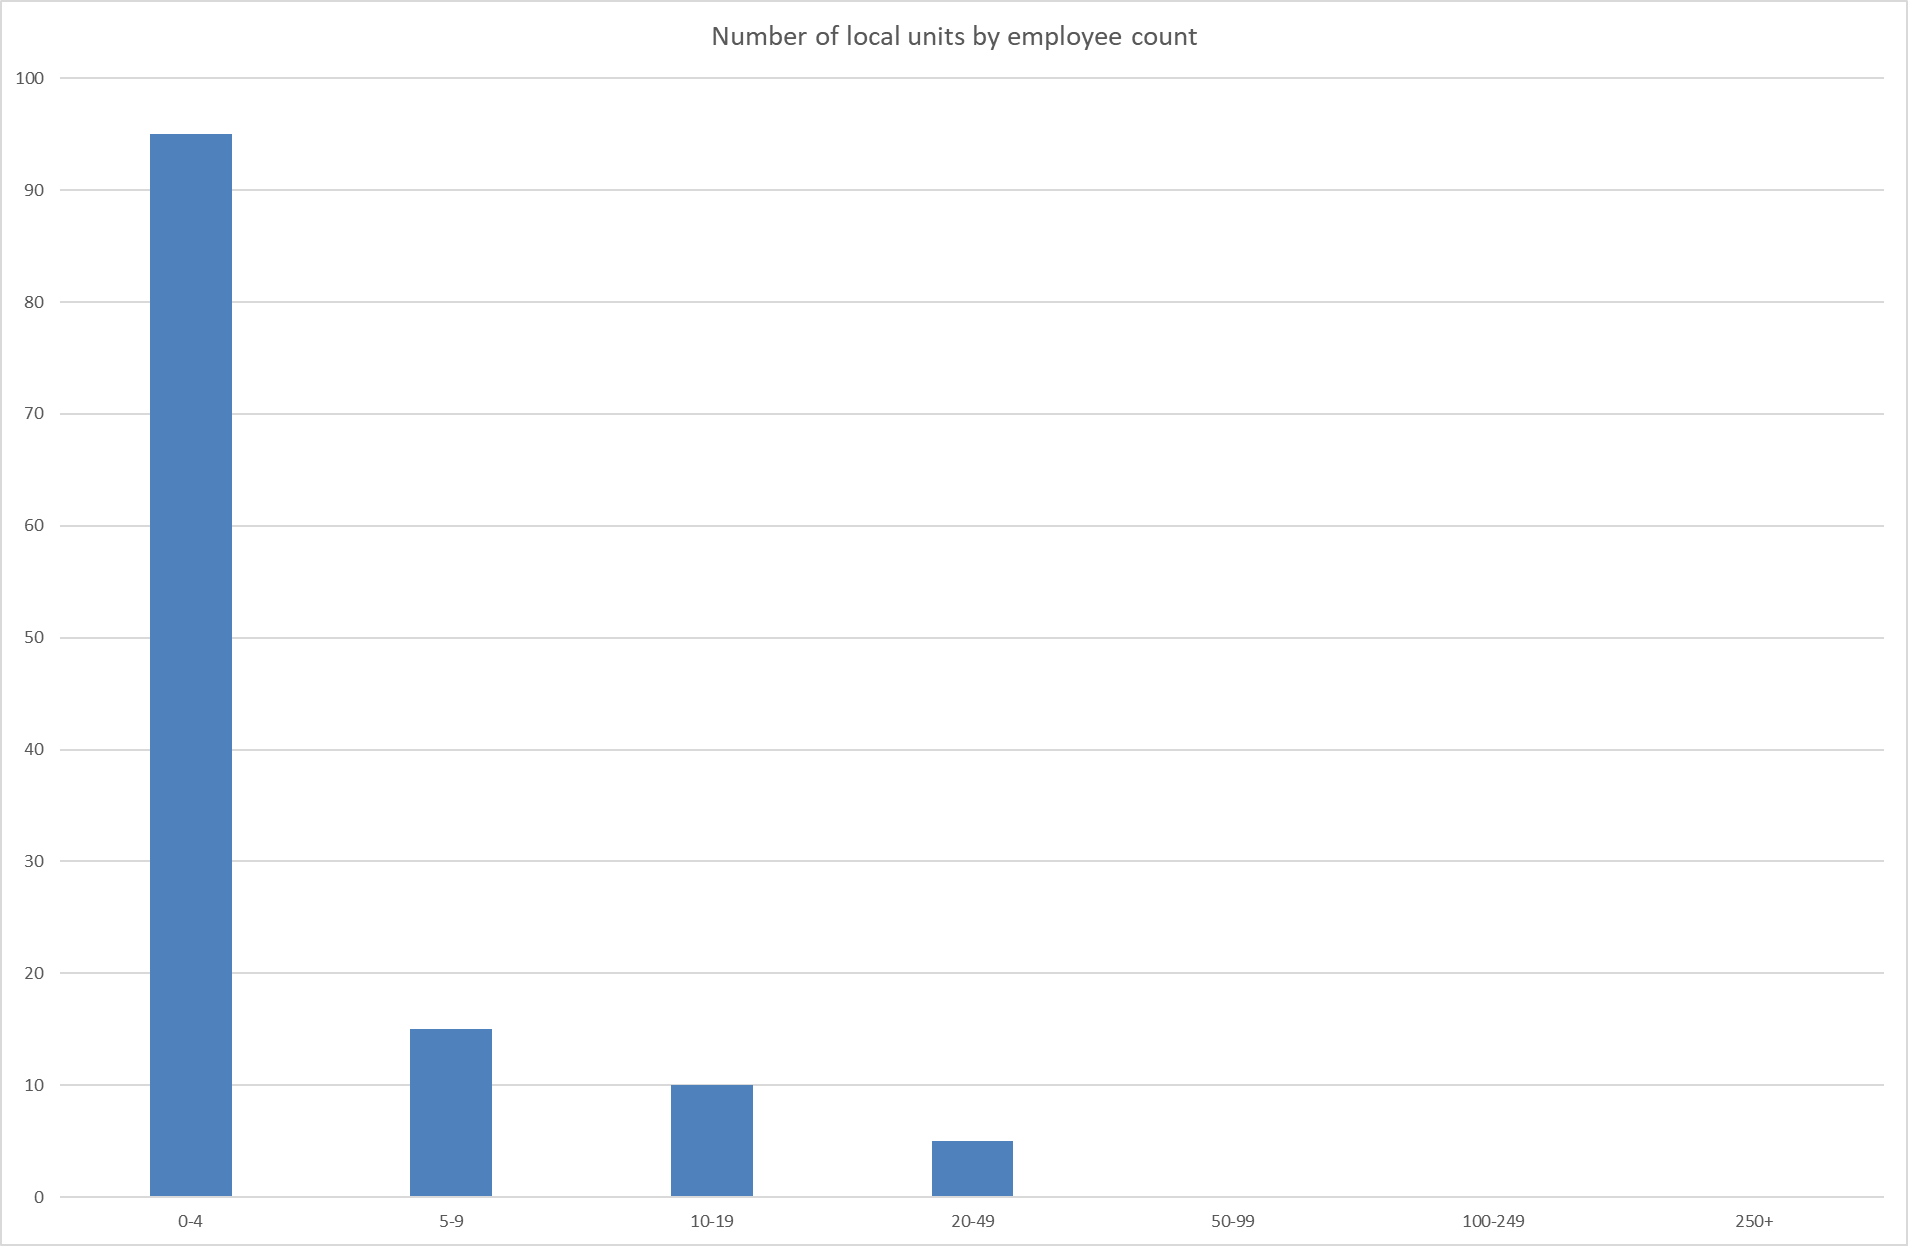
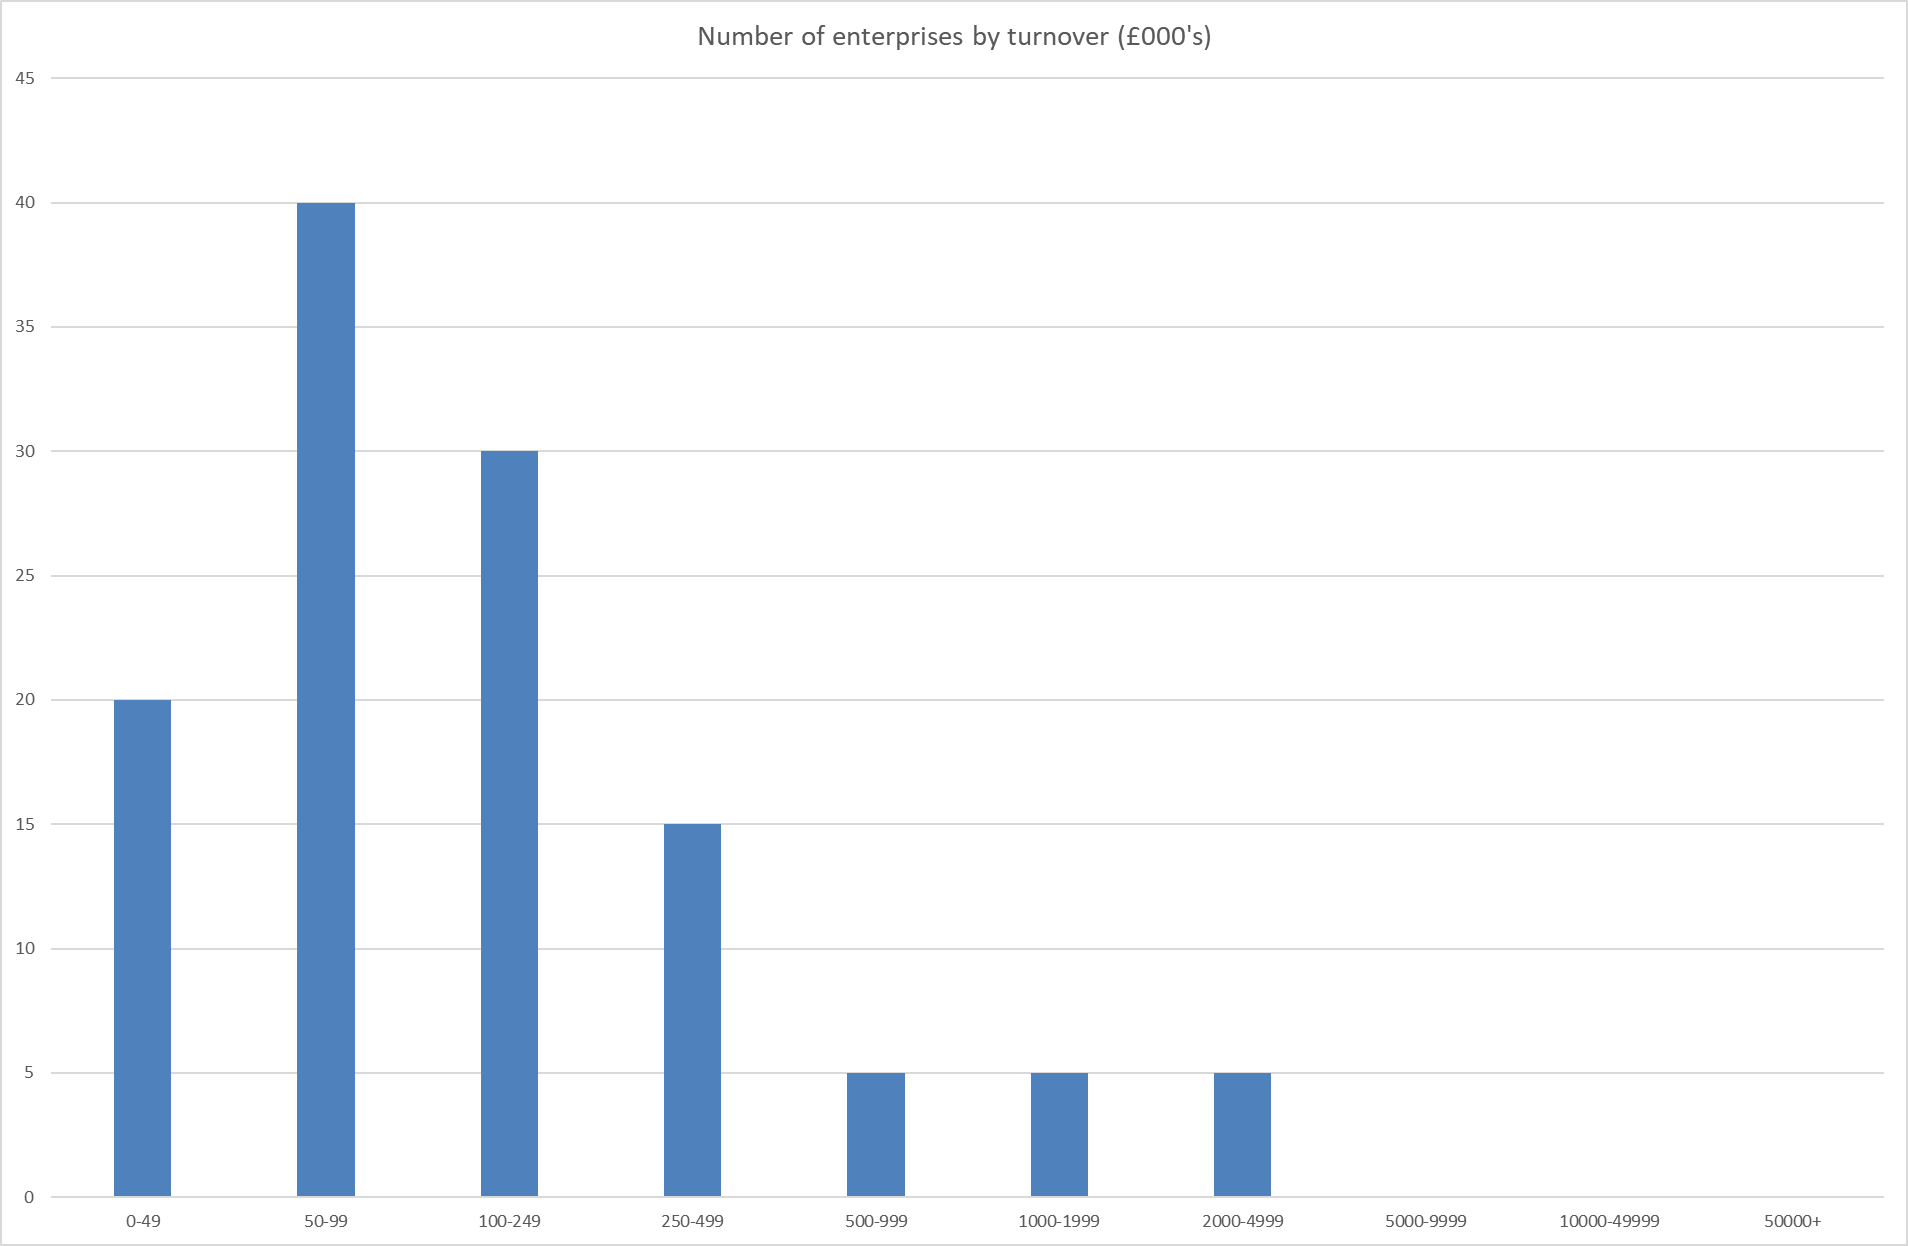
This uncovers a few insights. I’m surprised the South West has so many, joint-leader. Not surprisingly, London has more enterprises (parent companies) than local units (shops, factories), whereas most of the others are similar (suggesting they manufacture/sell near/at the head office), noting the East Midlands has more LUs than enterprises (presumably manufacturing sites). Employee counts for LUs and enterprises are similar, and the vast majority have <4 - suggesting they’re startups (which, as we saw above, is the norm for every industry). The largest category for turnover is not the smallest band, but the second-smallest, of £50,000-£100,000 (whereas for most industries the norm is the next bracket up, suggesting motorcycle manufacturers are smaller than the average UK company). Five companies made over £2,000,000, but none more than £5,000,000 - so they’re generally not the largest companies. I’d be curious what they are - I’d imagine Triumph is one of them
Now onto the demographics dataset. This does down to a three-digit SIC, so 309. Looking at the SIC list, this looks like it will also lump in “Manufacture of bicycles and invalid carriages” and “Manufacture of other transport equipment n.e.c.”, so unfortunately makes the data almost useless for our purposes - according to Companies House the former has 702 companies and the latter 2074, so our 404 motorcycle companies are only ~15% of the data.
I’m still curious what this dataset can show us when focussing on a specific industry, so I’ll pick 291, as this only includes 29100, “Manufacture of motor vehicles”. 2971 on Companies House (~45% active). Quickly checking the previous dataset, most are in the South East (the South West drops to 8th out of the 12 regions), most still have <4 employees (but 20 do have over 250), turnover is mostly in the £100,000-£249,999 range (dramatically so!), with 25 £50,000,000 plus. As for demographics:
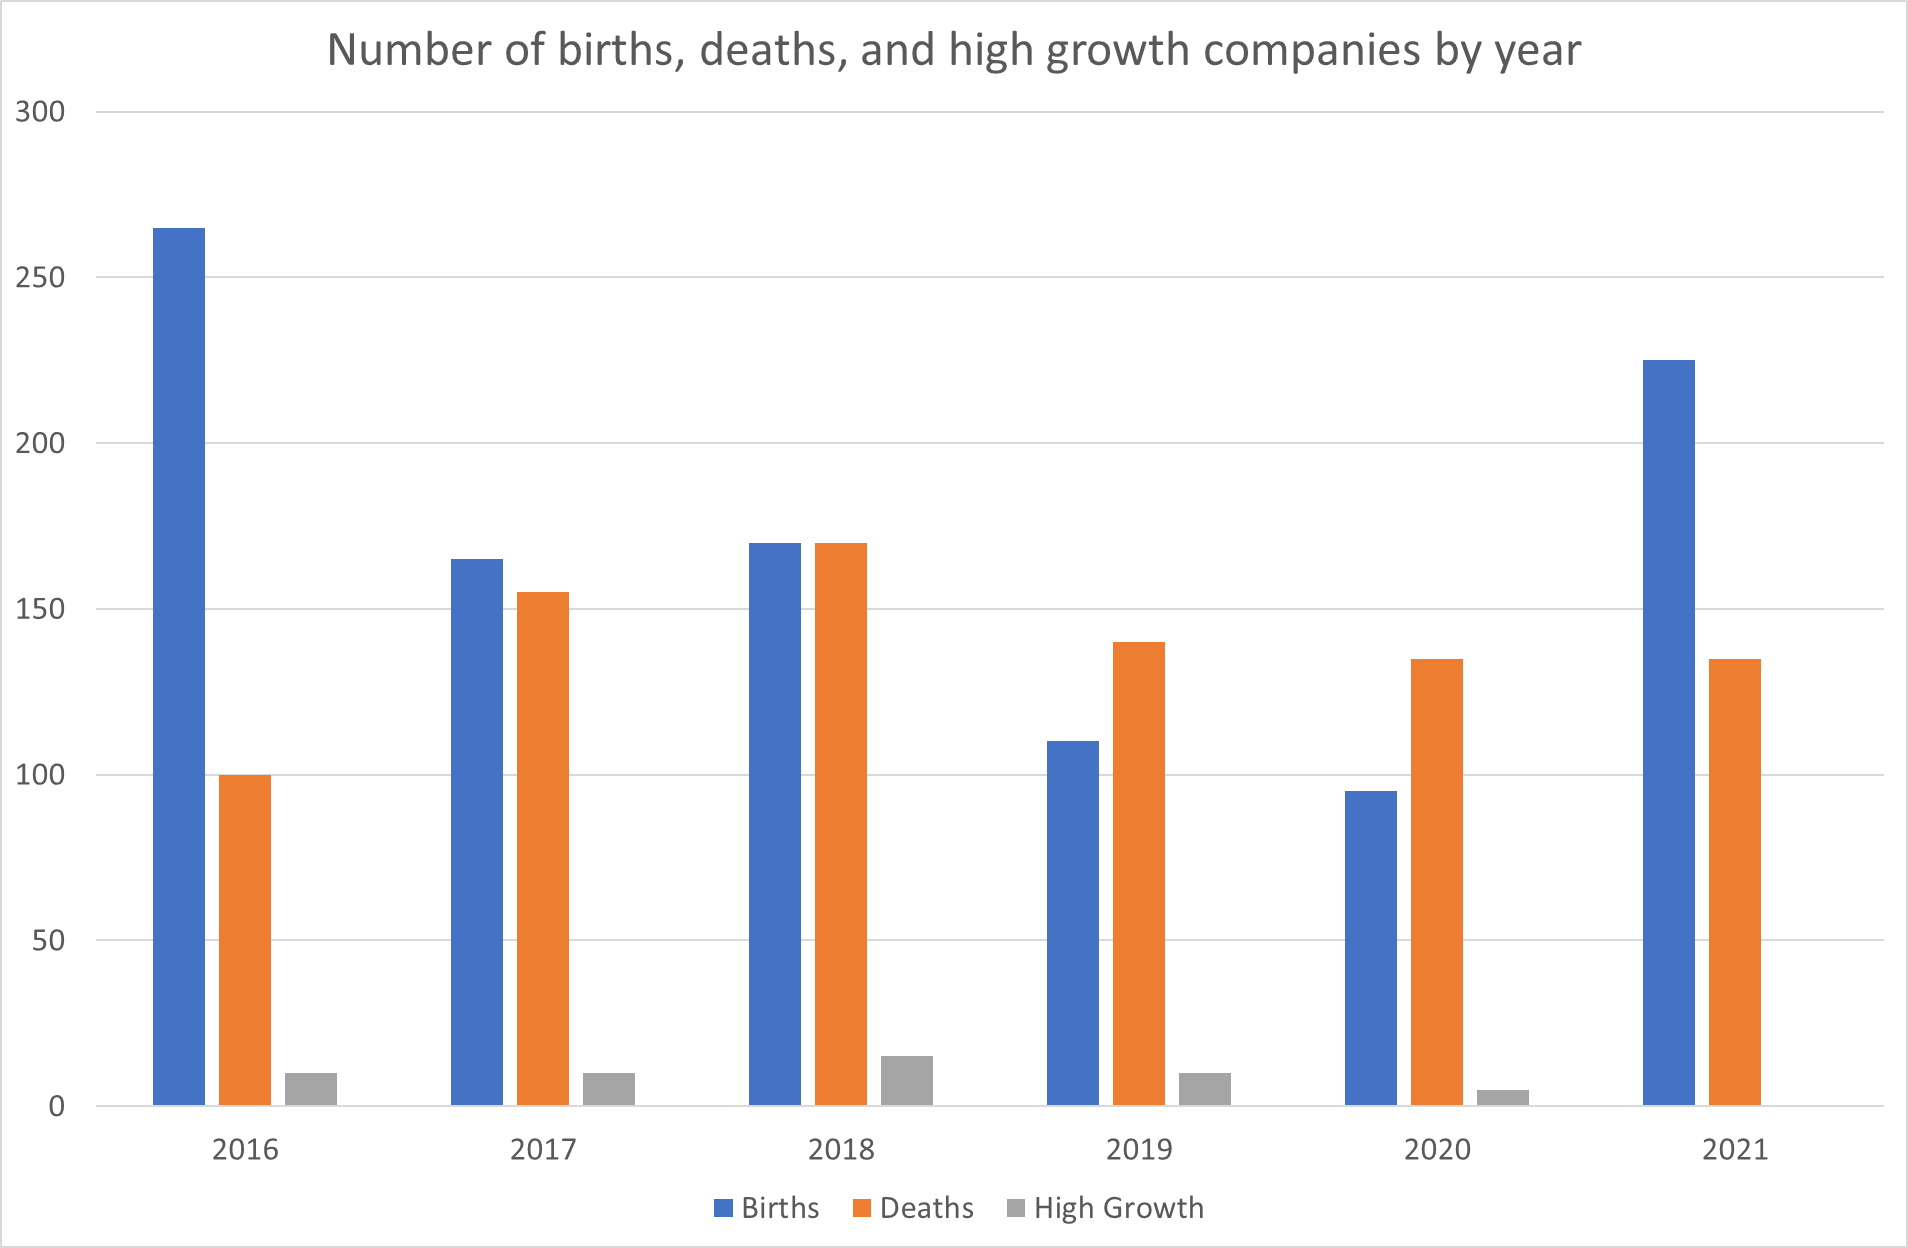
This is why the ratio statistics above have to be looked at in historical context. 2016 had far more births than deaths (this would have been the highest of any industry on our chart above), whereas 2019 and 2020 the ratio was below 1. Over the six years there were 1030 births and 835 deaths, giving a ratio of 1.2 - a small demonstration of reversion to the mean.
What happened to those 2016 babies?

About 30% made it to their fifth birthday, although if they made it to their third birthday they had a greater chance of surviving. Returning to the demographics dataset and comparing for all industries, this seems below average: 90% of companies make it through their first year, but a sharp drop to 70% survive the second. Over five years, on average, 40% are still going (although, similarly, if they reach their third birthday, there’s a higher chance they’ll be able to keep going).
What have I learnt?
I didn’t have any particular goals when starting this mini-project - it was purely out of curiosity. However, it has been a fun way to spend my time.
A couple of outliers surprised me. I wasn’t expecting the high number of high-growth Social work activities without accommodation companies, as it doesn’t seem like a high-growth industry. I also wasn’t expecting the high ratio of births:deaths for Electricity, gas, steam, and AC supply, as it doesn’t seem like there are many new entrants in the utilities space. Data can show ignorance.
Knowing that if a company reaches it’s third birthday it’s more likely to not die is something I’ll keep in the back of my mind, especially as on Companies House you can filter by established date. Perhaps something for my next research project…
Finally, for any aspiring entrepreneurs, the data could give an idea of competition, geographical recommendations, survival rates, and more. Also, knowing that my far most companies have under four employees could be the final push you need to realise you’re not alone - many companies are sole traders, or have only one business partner.