
Financial Modeling Foundations (LinkedIn Learning)
https://www.linkedin.com/learning/financial-modeling-foundations

Financial models should:
- Be simple
- Focus on key cash flow drivers
- Convey assumptions and conclusions
- Help evaluate risks through:
- Sensitivity analysis
- Break-even analysis
- Scenario analysis
Types of models
Comparison
Deterministic (known inputs, precise outputs) vs stochastic (probability-based, Monte Carlo simulations; more complex)
| Three Statement Model | DCF Model | Buyout Model | |
|---|---|---|---|
| Valuation from model | Present value of discounted free cash flow or multiples | lnvestment decision and implied value depends on equity IRR versus market hurdle rate | Entry multiple and acquisition premium depends on equity IRR and hurdle rate |
| Base case risk measurement | Weighted average cost of capital, multiples, terminal growth | Debt capacity, debt terms | Senior and subordinated debt financing and exit multiple |
| Traditional risk assessment from equity perspective | Sensitivity analysis and scenario analysis of DCF and multiple value | Sensitivity analysis and scenario analysis of equity IRR | Sensitivity analysis and scenario analysis of equity IRR |
| Tradition risk assessment from debt perspective | Break-even analysis to determine ability to refinance and maintain credit rating | Break-even analysis to determine at what point cash flow can’t service debt | Break-even analysis to determine IRR on senior and subordinated debt |
| Monte Carlo analysis with model | Probability distribution of EPS and DCF valuation | Probability distribution of equity IRR and probability of DSCR below 1.0 | Probability distribution of equity IRR, senior IRR and junior IRR |
| lnformation base | Historical financial statements, analysis of value drivers | Contracts and analysis of commodity prices and other value drivers | Historical financial statements, analysis of value drivers, transaction terms |
| Model starting point | Historic balance sheet | Sources and uses analysis | Sources and uses and pro-forma balance sheet |
| Cash flow process | Net cash flow after dividends that result in changes in short-term debt or surplus cash | Cash flow waterfall that ultimately measure dividends paid to equity | Cash flow waterfall that ends in dividends paid to equity |
| Debt analysis | New and existing | New debt issues from transaction | New debt issues from transaction |
| Model termination | Arbitrary terminal period | End of project life | Transaction holding period |
| Model output | DCF valuation, EPS projection, implied P/E, credit quality | Equity IRR, project IRR, DSCR | Equity and debt IRRs, debt/EBlTDA |
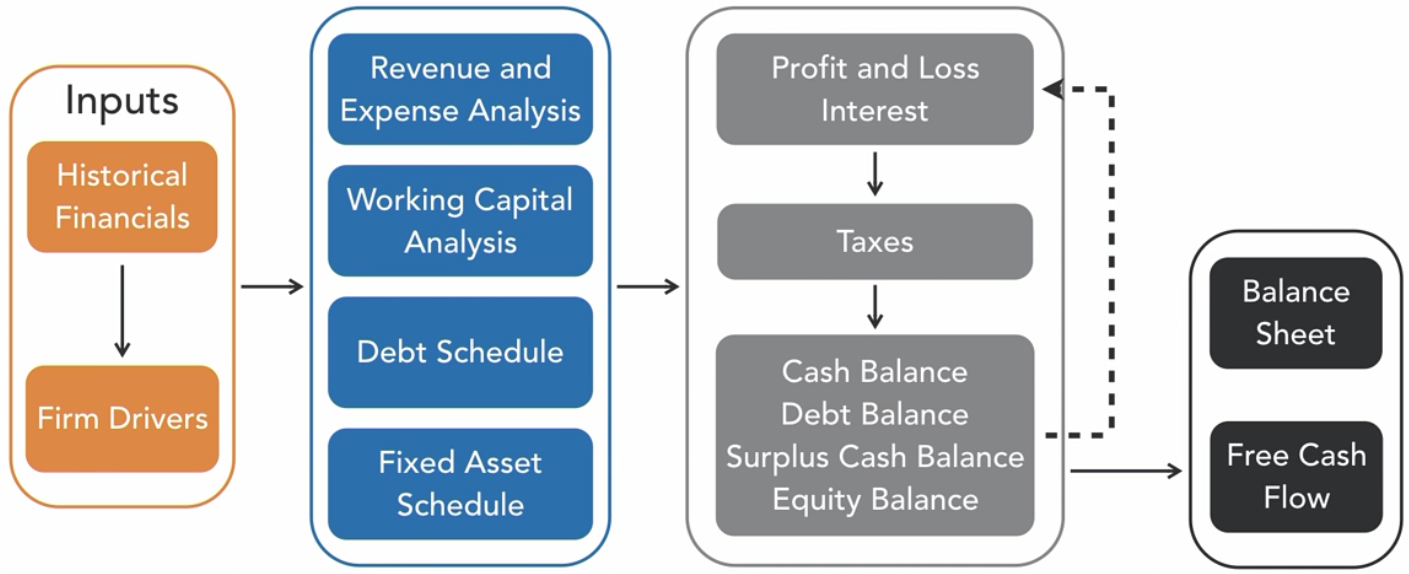
Corporate financial model (three-statement model)
02-0X, 03-0X files
Process
- Gather: historic financial statements
- Change: arrangement of financial statements
- Compute: ratios from historic financial statements to develop mechanical assumptions
- Develop: revenue, expense, and capital expenditures by working through value drivers
- Work through: income statement, cash flow statement, balance sheet to check, only for forecast years
- Valuation: sensitivity analysis and presentation
Project finance model (discounted cash flow model)
04-0X files
Need: Starting cash flow, growth rates (and change over time), discount rates (relates to risk)(often WACC is used)
Present Value: =PV(discount rate, number of periods, dividends, free cash flow (but -ve), 0)
Dividend Discount Model (DDM) Terminal Value: Latest value * (1 + future growth (%)) / (discount rate (%) - future growth (%)) → then calculate PV
Multiples Terminal Value: Latest EBITDA * EBITDA Multiple
Total Value of Firm = Sum of FCFs + TV
Discounted Cash Flow (DCF) Valuation = =NPV()/# shares
Internal rate of return (IRR): =IRR(CFs) → If IRR > discount rate/WACC, invest. Higher WACC = lower IRR.
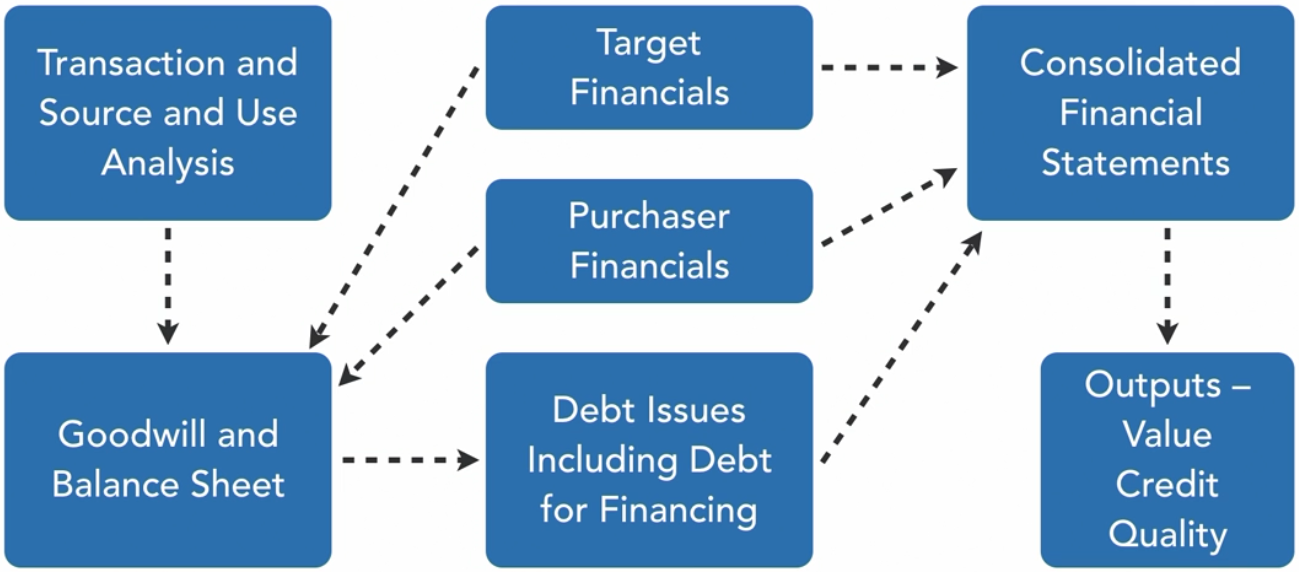
Leveraged buyout model (M&A model) and integrated consolidation model
Often includes DCF model and 3S model
Model uses
Corporate finance
Investment
Other notes
Hints and tips
- Don’t use long formulae
- Do keep inputs together
- Avoid circular references (check Formulas > Error Checking; also check Formulas > Trace in Excel) → potentially use fixed values instead of formulae (add comment or change colour so as not to lose track)
- Blue = hard-coded value, black = formula, green = link to other sheet
- Corkscrews: output of one as input of another, and repeat (e.g. year 1 end cash = year 2 start cash)
- Waterfall: input flowing through multiple calculations to final output (e.g. revenues → operating income → net income → total cash from operations → net cash)
- Toggles: e.g. scenario cell: best case, normal case, worst case →
=IF(scenario=1,100,IF(scenario=2,50,IF(scenario=3,10))) - Sensitivity analysis charts: Terminal Growth Rate or Terminal EBITDA Multiple vs Discount Rate; IRR vs Exit Multiple or % Debt
- FRED (Federal Reserve Economic Data) Excel Add-In → Interest rates, corporate bond yields, …
Growth rate analyses
Year-Over-Year Growth Rate: CAGR → most basic form, doesn’t change annually so can’t consider predicted recessions etc
Top-Down Analysis: Company market share (TAM: total addressable market) → Geographic segment → Product → Customer unit → Revenue
Top Down Growth Rate (%) = ((1 + Total Market Sales Growth (%)) * (1 + Market Share Growth (%)) * (1 + Order Value Growth (%)) - 1
Bottom-Up Analysis: Website traffic → Conversion rate → Order value → Revenue
Bottom Up Growth Rate (%) = ((1 + Prospect Traffic Growth (%)) * (1 + Conversation Rate Growth (%)) * (1 + Price Growth (%)) - 1
Regression Analysis: Relationships between factors e.g. marketing spend