Introduction to Business Valuation (CFI)
https://corporatefinanceinstitute.com/course/intro-business-valuation/

https://www.credential.net/6424b711-a689-4088-b6f7-4e389cedff20
The examples and spreadsheets included in the course are super useful! All also available here: https://learn.corporatefinanceinstitute.com/resources/templates/
General Corporate Finance
Asset valuation technique (based on replacement cost, liquidation value) isn’t used much so not in this course
Enterprise value (assets) = equity value (market cap = shares * price) + net debt (debt - cash)
Capital structure = debt to equity ratio
Payment order: vendors/employees (COGS) → debt holders (interest) → government (tax) → shareholders (net earnings)
Enterprise value and equity value both have pros and cons for valuation
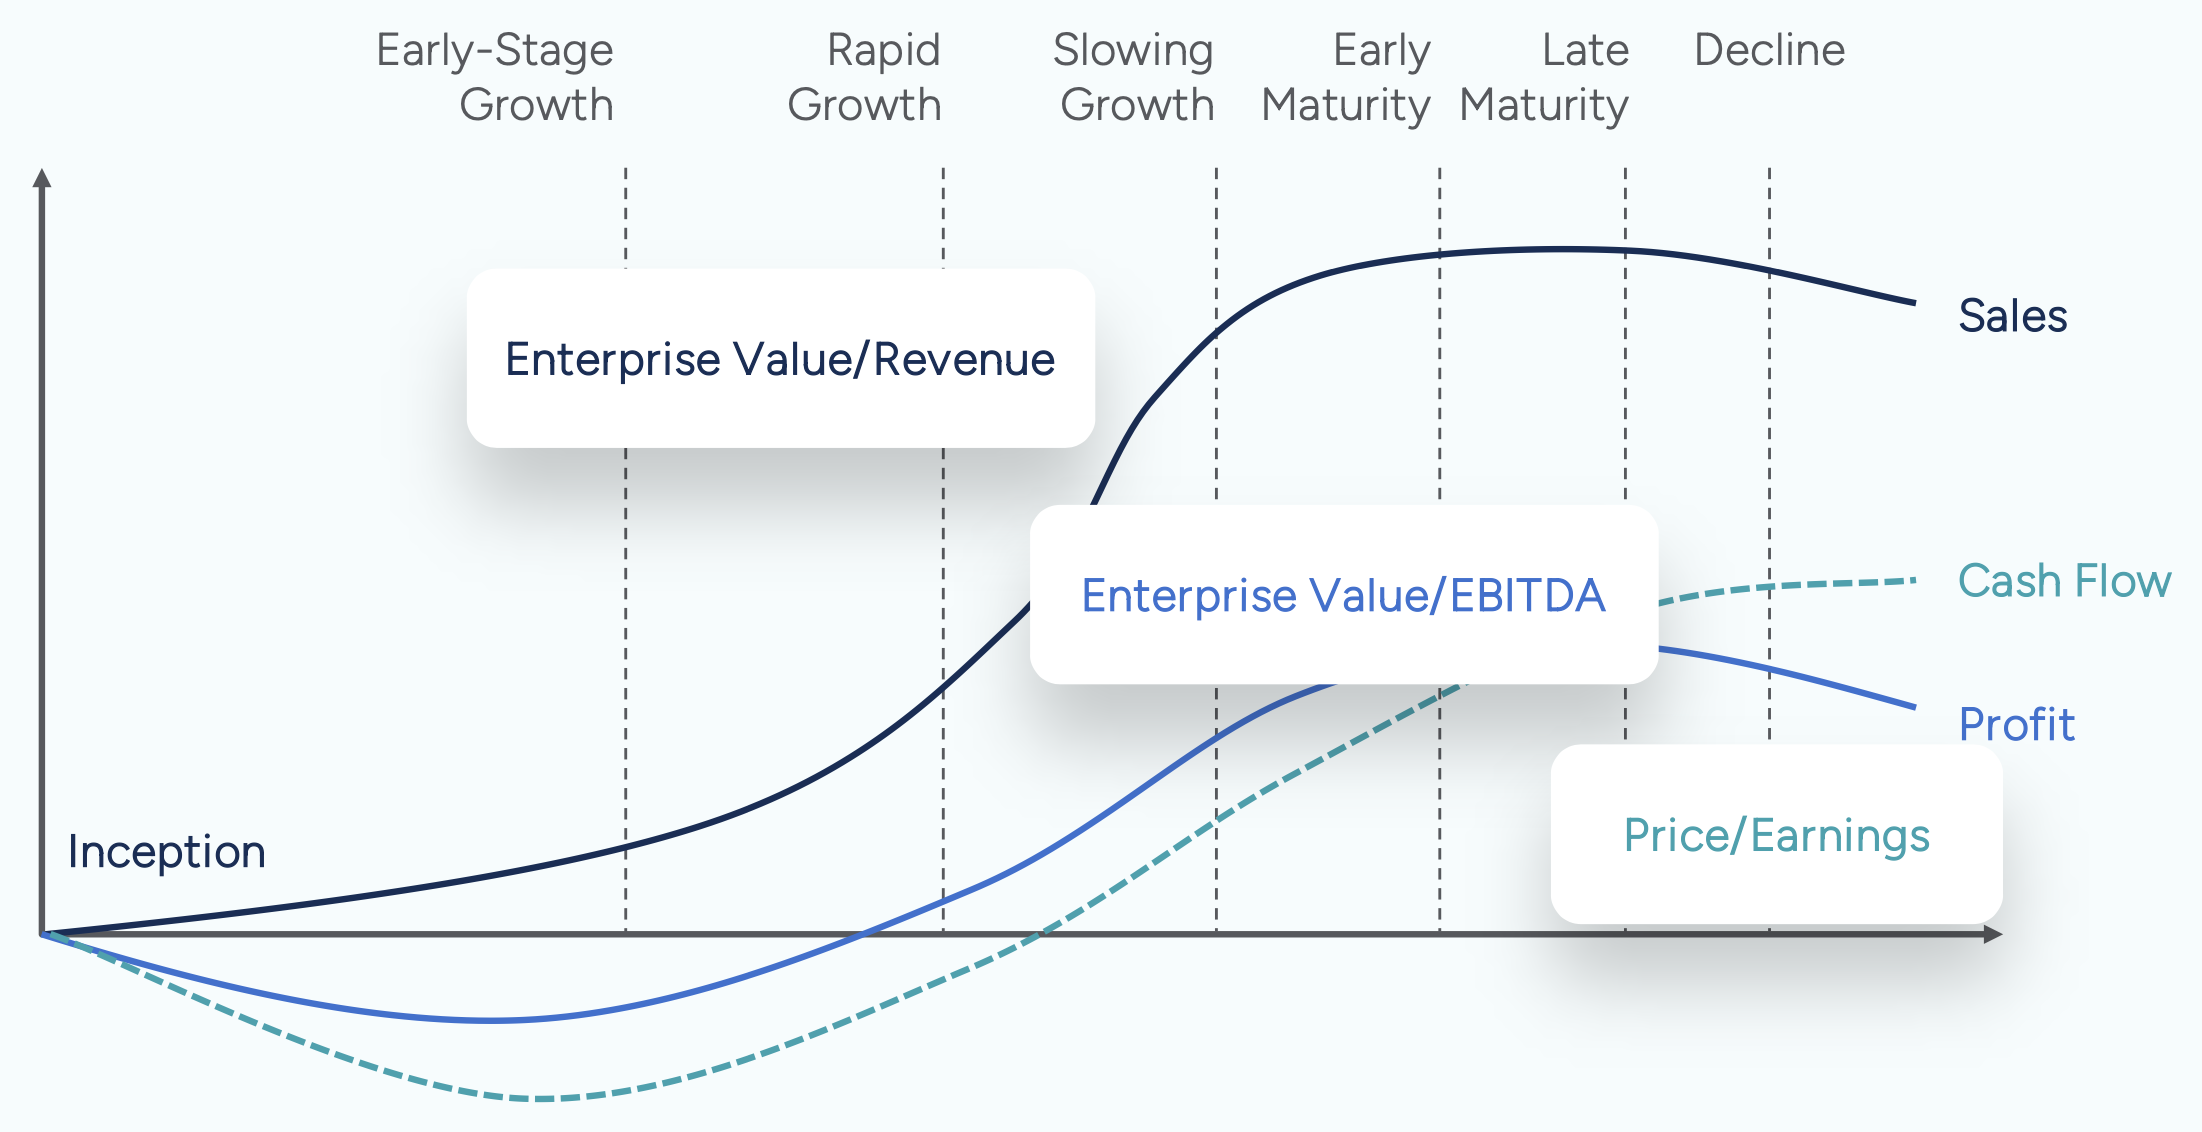
If metric is pre-interest, use enterprise value multiple (as unaffected by capital structure): EV/sales, EV/EBIDTA, EV/EBIT
If metric is post-interest, use equity value multiple (affected by capital structure due to interest payments): P/E, P/B
DCF Valuation
Pros and Cons
| Pros | Cons |
|---|---|
| Theoretically most correct | Only as good as the inputs (of which there are many) |
| Opportunity to learn about the company/industry | Easier to manipulate (by adjusting inputs) |
| Less prone to market conditions | Complex doesn’t necessarily mean precise |
Free Cash Flow
Unlevered free cash flow (UFCF)
- A.k.a. free cash flow to the firm
- Before paying debt
- More common
- DCF derives EV
- Use WACC
Levered free cash flow (LFCF)
- After met debt obligations
Difficulties
- Hard to estimate discount rate for private company
- Hard for young or financially distressed companies
Stage 1: forecast; stage 2: terminal value
UFCF =
- EBIT * (1 - tax rate) + depreciation and amortisation - capital expenditures - net increase in working capital
- Note: EBIT (aka operating income) * (1-tax rate) = net operating profit after tax (NOPAT)
- Net income + after-tax interest expense (interest expense * (1 - tax)) + depreciation and amortisation - capital expenditures - net increase in working capital
- EBITDA - unlevered cash tax (note: harder to get) - capital expenditures - net increase in working capital
WACC
- Yield not coupon
- Yield * (1 - tax rate)
Capital Asset Pricing Model (CAPM)
- Risk-free rate (e.g. yield of long-term govt bond) + premium (beta [change in stock return vs overall market] * equity risk premium)
- Alpha = firm-specific risk
- Diversification of stocks removes alpha within a portfolio
- Beta = market risk (beta of market = 1)
- If company has beta of 1.25 then it is riskier than the market → market +/- 1%, stock +/- 1.25%
- Return vs risk graph shows risk premium
- R-squared correlates stock and market → if too low, better to use industry beta
- Industry beta → unlever beta (levered beta / (1+(1-tax rate) * (debt/equity)) → average → relever beta (unlevered beta * (1+(1-tax rate)*(debt/equity))
Terminal Value
Note: Both must discounted back to present value
Note: Assume last day of fiscal year
Perpetuity Growth Method
TV = Last forecast UFCF * (1 + g) / (WACC - g)
Note: g is often market growth rate
Terminal Multiple Method
TV = Last forecast EBITDA * EV/EBIDTA
Note: Not always EBITDA, but commonly
NPV
=NPV(rate,values_1,value_n)
Assumptions
- Discounts all cash flows
- Occur at regular intervals
- Occur at end of the period/year
For cash flow occurring in middle of period/year: =NPV(rate,values_1,value_n)*(1+rate)^0.5
XNPV
=XNPV(rate,value,dates)
Assumptions
- Initial cash flow is not discounted
- Occur at regular intervals
- On a daily basis
Slightly more accurate because of leap years
IRR
Discount rate when NPV = 0 (hurdle rate)
IRR > CoC, profitable → invest!
=IRR(values,[guess])
Assumptions
- At least one positive and one negative value
XIRR
=XIRR(values,dates,[guess])
Assumptions
- First value is usually negative
- Values in chronological order
- Dates correspond to the periodic cash flows
Slightly more accurate because of leap years
Relative Valuation
Comparable Companies or Precedent Deals
Pros and Cons
| Pros | Cons |
|---|---|
| Simple | Can be too simplistic |
| Observable data | All companies are different |
| Reflects current market conditions | |
| For M&A, can show premium |
Multiples
Multiples affected by
- Growth rates
- Management team
- Mispricing
- Accounting policies
- For precendents:
- Age of deal
- Lack of deals
| Multiple | Pros | Cons |
|---|---|---|
| EV/Revenue | Younger companies haven’t reached profitability | Doesn’t account for costs Revenue is an incomplete measure of performance |
| EV/EBITDA | Commonly used Used for industries with large amounts of long-term assets |
Net income is the bottom line EBITDA doesn’t include reinvestment |
| P/E | Used for mature, publicly traded companies | Demoniator based on accrual accounting which can be manipulated |
| P/B | Used for banks | Limited usefulness for non-banks |
Process
-
Select companies for similar:
- Industry
- Geographical location
- Size and growth profiles
- Profitability
- Accounting policies
- Capital structure
- Extra for precendents
- Recent deals
- Buyer
- Strategic buyer will pay more to benefit from synergies
- PE buyer will pay less as no synergies to be gained
Capital IQ can provide this data
-
Enter data
- Note: Purchase price is effectively EV for precedent valuation
-
Value using multiples
Football Field Chart
x = valuation techniques, y = value
- Create table: min, midpoint, max for each valuation method
- Create stacked column
- No fill for max and min
- Data labels for max and min
- Average valuation = manually drawn line
- Textbox with formula (TEXT function for formatting)