Logo James's Peredutions
  • Home
  • About
  • Latest
  • Accomplishments
  • Selected Projects
  • Featured
  • All Posts
  • Tags
  • Search
  • Dark Theme
    Light Theme Dark Theme System Theme
Logo Inverted Logo
  • All Posts
  • Data and Analytics
  • Business and Consulting
  • Climate and Energy
  • Cognition and Learning
    • Book Notes
    • Course Notes
    • Other
  • Contemplations and Society
  • IT and Technology
    • How-Tos
    • Scripts
      • Bookmarklets
      • Userscripts
  • Projects
    • Android
    • Arduino
    • Python
    • Web
  • Cyber Security
    • Challenges
    • Operational Technology (OT)
    • Other
Hero Image
Podcast Sentiment and Topic Analysis

Intro I am a bit of a podcast addict. One of the podcasts I listen to most, The Jordan Harbinger Show, has Feedback Friday every week. It’s effectively an agony aunt, except with two uncles. I always loved it, but over time I’ve felt it has become too negative - too many stories about addiction and abusive relationships. They’re interesting to discuss, but they’re a bit depressing. I wanted to test this hypothesis. Jordan is nice enough to provide all the transcripts on his website, so I thought I’d analyse the FBF episodes from the last year and see if they really are negative. While I had the data, I thought it would be interesting to extract common themes and topics too.

  • Data Science
  • Data Analysis
  • Natural Language Processing
  • Python
Thursday, January 2, 2025 | 11 minutes Read
Hero Image
Learnings 2024

Notes from 156 things I’ve consumed in 2024. Updated 31/12/2024.

  • Consumption
  • Media
Tuesday, December 31, 2024 | 35 minutes Read
Hero Image
Spotify Wrapped DIY

I was a bit disappointed with my Spotify Wrapped this year, and it seems I wasn’t the only one. The insights weren’t as interesting, the graphics weren’t as exciting, and some of it seemed irrelevant. Plus, of course, you only get one a year. So I thought I’d create my own. The code isn’t pretty; it’s something quick and dirty thrown together over a couple of hours. You can see it on my GitHub: https://github.com/jamesdeluk/data-projects/tree/main/spotify-wrapped-diy

  • Data Analysis
Wednesday, December 18, 2024 | 4 minutes Read
Hero Image
Disaster Tweets Natural Language Processing

Intro I have a dataset of tweets, which includes whether they are referring to a disaster or not. The goal is to build a model that takes a tweet and predicts if it is a disaster. This could be useful during an actual disaster to ensure only the most relevant ones are shown to emergency responders. The full code for this project can be found on my GitHub: https://github.com/jamesdeluk/data-projects/tree/main/nlp-with-disaster-tweets Exploring and cleaning the data I started by looking at the raw data in a text editor; as it was only a few hundred kilobytes, it was easy enough to do:

  • Data Science
  • Data Analysis
  • Natural Language Processing
  • Regression
  • Python
Wednesday, December 11, 2024 | 26 minutes Read
Hero Image
SQL Murder Mystery Solution and Walkthrough

I recently heard of SQL Murder Mystery (https://mystery.knightlab.com/), a website that uses gamification to learn/practise SQL skills. There’s been a murder, and by searching the SQL database you can find out whodunit. Seemed like a fun challenge. Here’s the prompt: A crime has taken place and the detective needs your help. The detective gave you the crime scene report, but you somehow lost it. You vaguely remember that the crime was a murder that occurred sometime on Jan.15, 2018 and that it took place in SQL City. Start by retrieving the corresponding crime scene report from the police department’s database.

  • Data Science
  • Data Analysis
  • SQL
Thursday, December 5, 2024 | 5 minutes Read
Hero Image
Customer Analysis Part IV: Brand Analytics and Elasticity

This is part four of a multi-part series. Part one, segmentation and clustering, can be found here. Part two, classification, is here. Part 3, purchase analytics, here. As before, the code below is simply snippets. The full code for this section can be found in the repo: https://github.com/jamesdeluk/data-projects/blob/main/customer-analysis/ca4_brands.ipynb 
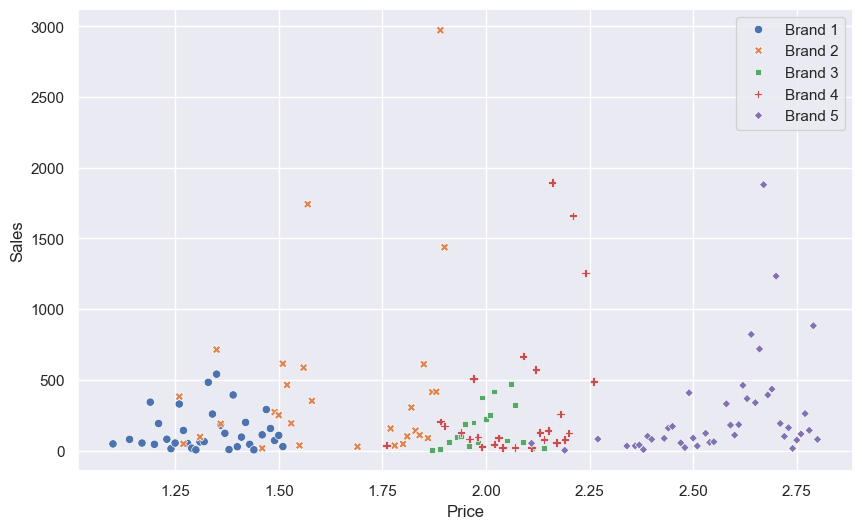
Intro At last we reach out final part in this series. Here we’re looking at brands, quantities, and elasticities. Data The first thing is to reimport the data, the same as part three. I also created NumPy array of prices I’ll use later for testing and simulation. We know the prices in our dataset range from 1.10 to 2.80; for nice numbers, I picked 1.00 to 3.00, in 0.01 intervals:

  • Data Science
  • Data Analysis
  • Purchase Analytics
  • Customer Analysis
  • Regression
  • Python
Sunday, December 1, 2024 | 20 minutes Read
Hero Image
Customer Analysis Part III: Purchase Analytics

This is part three of a multi-part series. Part one, segmentation and clustering, can be found here. Part two, classification, is here. This post contains incomplete code snippets. The full code for this section can be found in the repo: https://github.com/jamesdeluk/data-projects/blob/main/customer-analysis/ca3_purchases.ipynb UPDATE 2024-11-26: During part four I noticed I had made a mistake in the Product Analysis section - I’d accidentally used a subset of the dataset when doing an analysis. Given part four is exclusively about product and brand analysis, I have moved the now-corrected section to that post.

  • Data Science
  • Data Analysis
  • Purchase Analytics
  • Customer Analysis
  • Python
Friday, November 22, 2024 | 20 minutes Read
Hero Image
Customer Analysis Part II: Classification

This is part two of a multi-part series. Part one, segmentation and clustering, can be found here. Code for this section can be found in the repo: https://github.com/jamesdeluk/data-projects/blob/main/customer-analysis/ca2_classification.ipynb Intro Great, we have our customers clustered! But, hopefully, over time, we’ll gain more customers, and they’ll need to be assigned to an existing cluster. This is called classification. There are a few techniques for doing this. First, let’s remind ourselves what our current clusters look like by grouping the data and finding the means, as we did in part one:

  • Data Science
  • Data Analysis
  • Classification
  • Regression
  • Customer Analysis
  • Python
Monday, November 18, 2024 | 19 minutes Read
Hero Image
Customer Analysis Part I: Segmentation and Clustering

This is part one of a multi-part series. Part two can be found here. Intro Customer analysis is one of the most important uses of data science. The better an organisation knows their customers, the better they can ensure their needs are met. This could be a supermarket providing special offers on a customer’s common purchases, a charity tweaking their messaging based on their’ donator’s personal interests, or a distributor using purchasing trends to determine where to open a new warehouse.

  • Data Science
  • Data Analysis
  • Segmentation
  • Clustering
  • Customer Analysis
  • Python
Wednesday, November 13, 2024 | 18 minutes Read
Hero Image
Predicting Belgium’s future solar PV generation: Part II

This is part two of a two-part series. Part one covered collecting and processing the data, then assessing the forecasts in the dataset. It also contains the link to the dataset and repo. This part covers my predictions, using machine learning. Intro OK, we’ve looked at the data, and we’ve seen how accurate their predictions are/were. Can I do any better? I’m taking three approaches: SARIMA, TensorFlow, and Prophet. A quick aside: Why do we want to predict the future energy generation? There are a number of reasons.

  • Data Science
  • Data Analysis
  • Time Series
  • Python
  • Energy
Friday, November 8, 2024 | 15 minutes Read
Hero Image
Predicting Belgium’s future solar PV generation: Part I

This is part one of a two-part series. This part covers collecting and processing the data, then assessing the forecasts in the dataset. Part two covers my predictions. Intro I have a friend who owns a solar management platform, and he asked me to investigate some solar PV generation data provided by Elia, one of Belgium’s transmission system operators. The data includes measured solar PV generation by region, along with their various forecasts.

  • Data Science
  • Data Analysis
  • Time Series
  • Python
  • Energy
Sunday, November 3, 2024 | 15 minutes Read
Hero Image
How much for my car? Using machine learning to find out

Intro I own a wonderful Ford Fiesta ST-3 (2017, 7th generation, 38k miles), but since moving to London, she’s been sat at my parents’ house. I finally accepted it’s best to sell her. But how much should I ask? Let’s do some data analysis and machine learning! The JupyterLab notebook, extractor script, and data, is available on Github: https://github.com/jamesdeluk/data-projects/tree/main/car-price-regression-modelling Gather the data Auto Trader makes it difficult to scrape data - the page is loaded dynamically, and has robots.txt etc to restrict bots, so I couldn’t find an online tool that worked. They do provide an API, but that’s only for industry, and likely costs a pretty penny.

  • Data Science
  • Data Analysis
  • Regression
  • Python
  • Cars
Wednesday, October 16, 2024 | 21 minutes Read
  • ««
  • «
  • 1
  • 2
  • 3
  • 4
  • 5
  • »
  • »»
Contact me:
  • james@gibbins.me
  • jamgib

Home page image source: 홍지우